If you’ve visited CloudZero lately, you’ve probably seen a few changes. New logo, new app, new website, new look and feel — okay, more than a few changes.
What provoked the rebrand? As CloudZero co-founder and CTO Erik Peterson puts it, “The cloud has undergone a torrid evolution.” A short list of generalized vendors has expanded to a giant list of specialized vendors; containerized spend has added new roadblocks to billing data visibility; and overall cloud spending has skyrocketed.
Controlling your cloud spend means wresting order from the chaos of the cloud. That’s exactly what CloudZero is built to do. Our new logo — inspired both starling murmurations, M.C. Escher’s “Relativity,” and other impossible geometries — reflects our commitment to this process. And we’ve got a snazzy new app to boot.
That’s where this month’s release notes start. Take a look at what our product team accomplished in October, and stay tuned for more updates like these in the future!
The 2023 CloudZero Makeover (Rebrand)
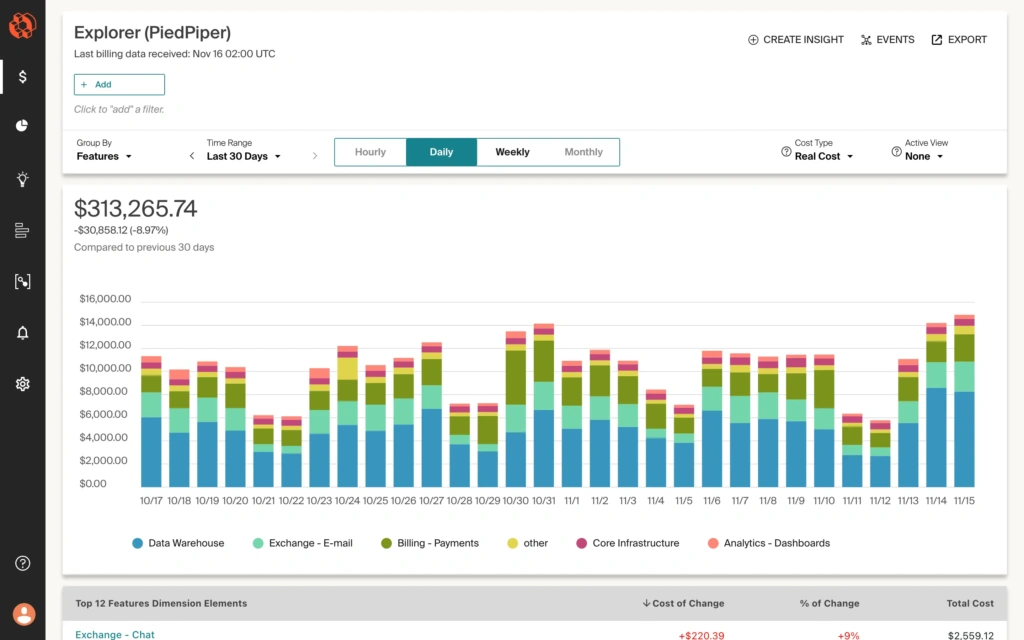
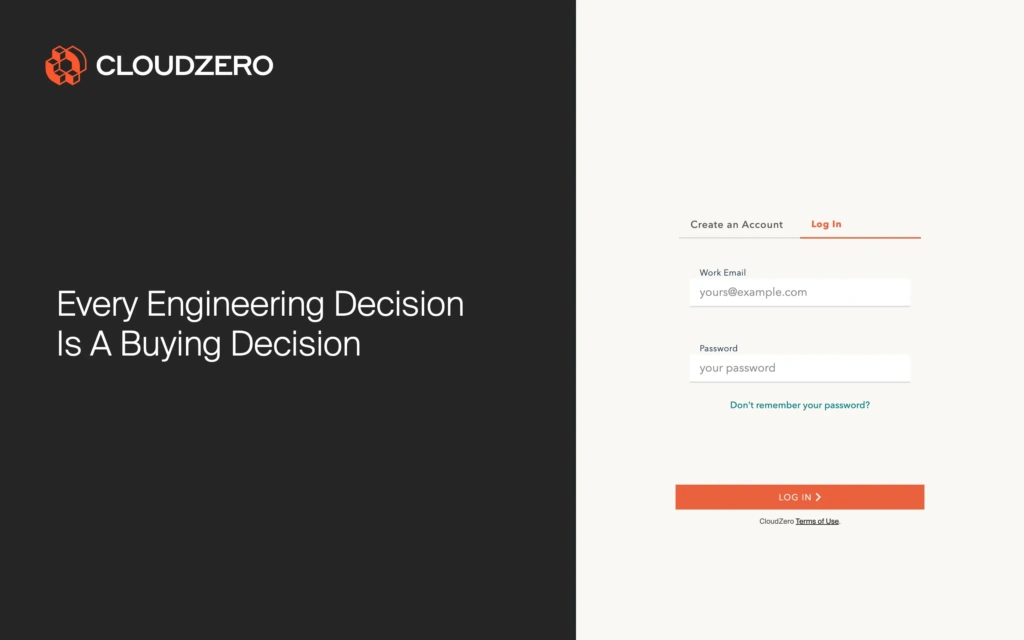
Introducing: A made-over app with sharper colors, fonts, buttons, and more — making it even more seamless to peruse your spend data. The new colors also make it substantially easier for people with color blindness to read our data visualizations, enhancing the accessibility of our app.
The app makeover is a subset of our rebrand: new logo, new website, and new identity. A lot has changed since the founding of CloudZero, and our new look and feel reflects it. Curious to learn more? Read CloudZero co-founder and CTO Erik Peterson’s blog on the philosophy behind the rebrand.
Status: Runway-ready
Role-Based Access Control: New Editor Role
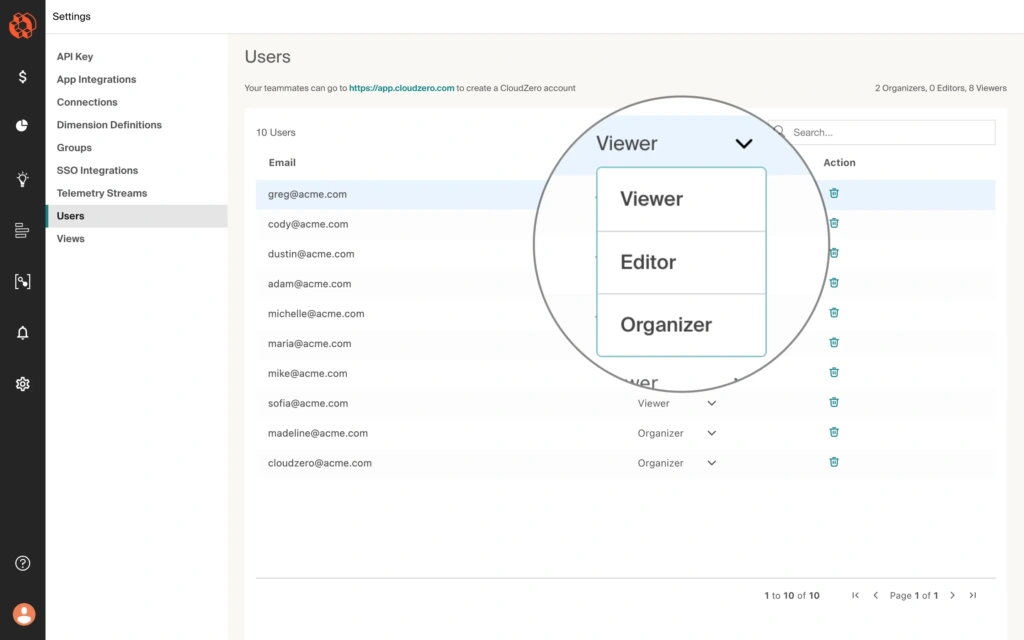
Introducing: A new CloudZero user role, Editor, gives you more power to define who in your organization is responsible for which aspects of your FinOps and cloud cost management jobs. Editors can see and edit Analytics and Insights; the more detailed role definition helps organizations more easily shift left and power engineering-led optimization.
You can use it to: Segment your CloudZero users according to a new hierarchy:
- Admins — Full read/write access
- Editors — All of the permissions of Viewers, but also have the ability to create and modify Analytics and Insights
- Viewers — Read-only access
Analytics lets you visualize your cloud billing data however you want. The Insights Feature lets you log and track savings opportunities. Combining these, CloudZero Editors can conduct nuanced analyses and make a positive impact on your overall cloud spending.
Status: Live (read more in our documentation)
Usage Data In Analytics
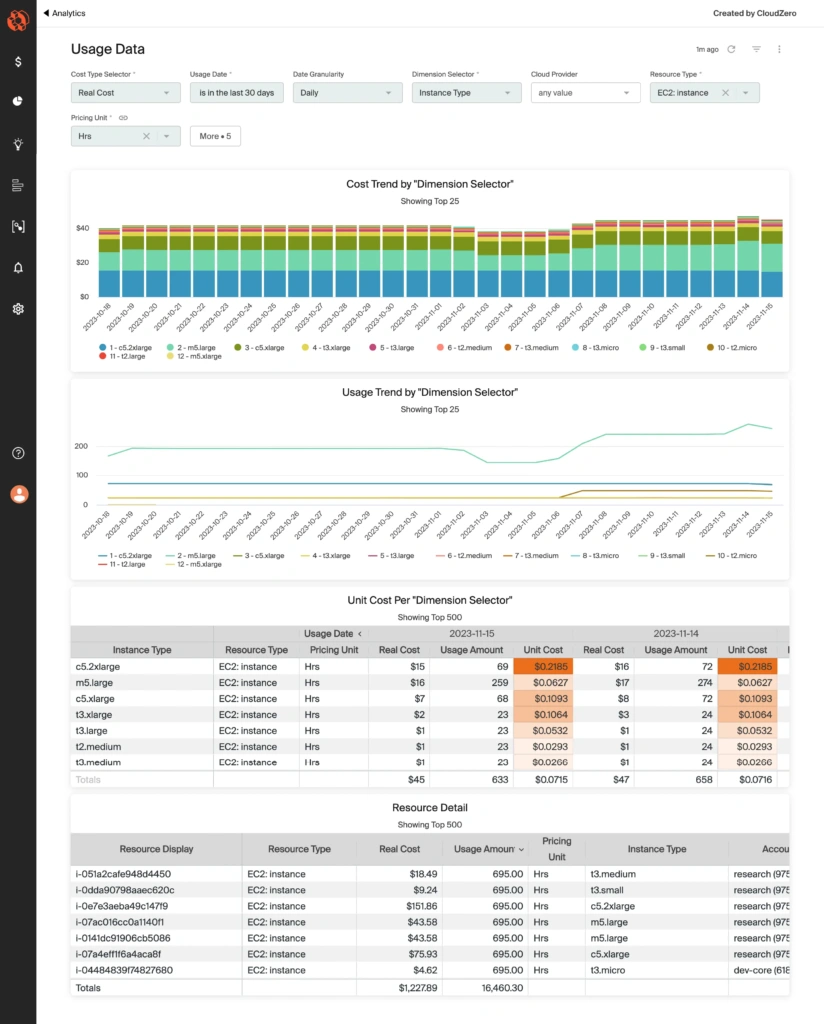
Introducing: Cloud usage drives cloud billing, and as we all know, every engineering decision is a buying decision. A new standard dashboard — and custom dashboarding capabilities — lets you correlate cloud usage data with cloud billing data.
You can use it to: Track your costs by simple, infrastructure-based unit metrics, and assess whether your cloud spending is getting more efficient over time. Check out our standard Analytics dashboard today to start playing with it.
Status: Live!
View Your Data By GCP Tags
Introducing: The power to see your GCP data broken down by GCP tag values, the hierarchy your organization custom-built for GCP.
You can use it to: Mirror the allocation of Google Clouds’s resource hierarchy in CloudZero CostFormation®, Explorer, Analytics. Seamlessly combine data from GCP labels, GKE tags, and any other cloud you need to get unparalleled visibility into your spend.
Status: Live!
CostFormation® Proportional Allocation Improvements
Introducing: A key update to CostFormation’s proportional allocation engine: “Partitioned” allocations!
You can use it to: Expedite and simplify the process of allocating complex costs to the appropriate drivers. Proportional allocation has never been this exciting.
Status: Live!
Small Bites
Introducing: A couple of extra morsels:
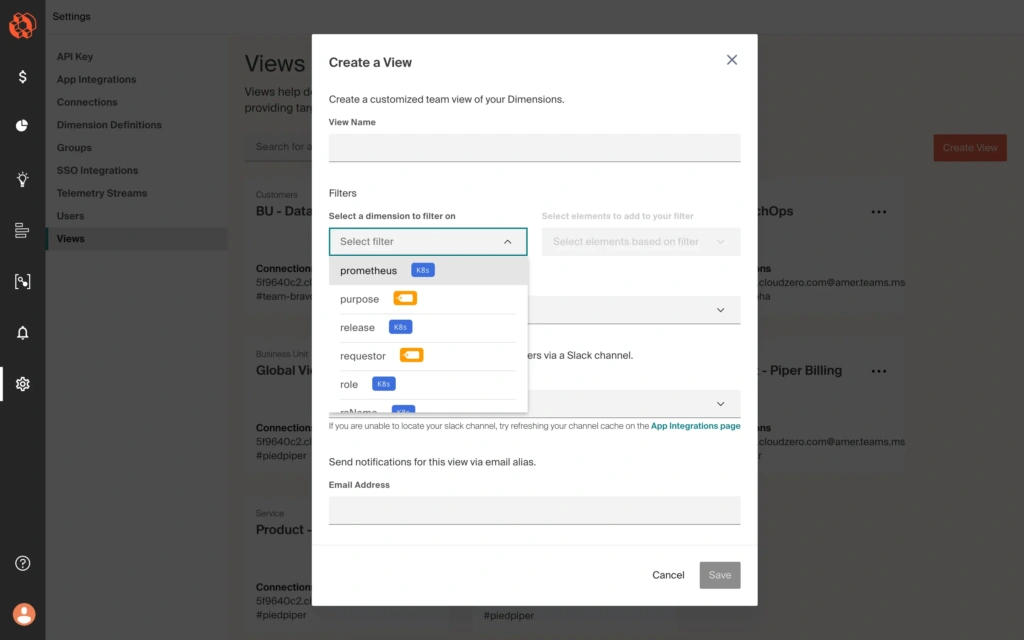
- Views Usability Update: See the tag/Dimension/Kubernetes label type when creating a View, making it easier to ensure that you’re selecting the right item (e.g., Dimension, tag, etc.) when creating Views — and aligns with the display when filtering the Explorer.
- Anomaly Selection: When you select an anomaly, the relevant bar in the Explorer chart will now light up, helping you resolve anomalies more quickly.
You can use it to: Analyze your data and find savings more delightfully.
Status: Live!
