It’s no secret. Competition is more than fierce in SaaS; it’s also bitter. The competition will enter any market, area, and idea as long as there’s money to fund it — even if the margins are close to zero. Having an observability tool like New Relic or New Relic alternatives can be the key to protecting your margins.
A few hours of service disruption, a software bug, or unoptimized code deployment can significantly impact customer experience. And this can have a major impact on your market share, active subscriptions, and renewals for months and years to come.
A good monitoring service can help you detect, visualize, and resolve potential issues before they become costly business problems. New Relic is one of the most comprehensive monitoring tools today. Yet it isn’t for everyone.
In this guide, we’ll share why that may be and over a dozen of the best alternatives to New Relic so you can pick your best.
What Is New Relic?
New Relic provides full-stack observability. You can use New Relic to monitor your applications, infrastructure, web browsers, and other components on a single platform.
And it goes deep, too. New Relic uses Metrics (numeric measures of app performance), Events (activities within the apps), Logs (in-depth event records), and Traces (transaction details) for deep analysis. This makes it easier for your team to pinpoint issues, understand customer experiences, and optimize system performance.
New Relic tracks everything from page load times to complex transactions across distributed systems. Its suite extends into real user monitoring, server monitoring, and application diagnostics, all presented in an intuitive, user-friendly dashboard.
All these capabilities make the New Relic platform crucial for teams that want to optimize their digital services.
Yet, New Relic may not be suited to all organizations.
Research Report
FinOps In The AI Era: A Critical Recalibration
What 475 executives told us about AI and cloud efficiency.
Why Consider New Relic Alternatives
Some organizations may not find New Relic to be quite what they are looking for for several reasons. Some common complaints about New Relic include that it can have quite a steep learning curve, which is to be expected for such a comprehensive tool.
Other drawbacks of New Relic include:
- Limitations on active sessions and IP addresses: New Relic limits the number of active sessions and IP addresses that a user in an organization can have at one time. For larger organizations, this restriction may become a concern when scaling.
- Cost considerations: New Relic does offer a comprehensive set of features — and a matching price tag. Some users find New Relic pricing complex, high, and confusing compared to other monitoring platforms (we’ve included some of those in this guide).
If you are looking for a more budget-friendly monitoring platform than New Relic, you’ll also want to consider our guide for a deeper dive into how New Relic pricing works.
Do You Need A New Relic Alternative?
Well, that depends on several key factors, the most important of which is how closely New Relic’s monitoring capabilities align with your current and future business goals.
Here are some considerations to help you make this decision:
- Budget considerations: If New Relic’s pricing model strains your budget, especially as your company grows, you may want to consider alternatives. New Relic is best for companies with complex monitoring needs to justify the cost and usage-based pricing model.
- Unique features: Are there specific features or capabilities, such as advanced log management or AI-driven analytics, that you require and New Relic isn’t fully covering?
- Ease of use and integration: Consider how user-friendly and extensible the platform is with your existing tech stack. You’ll want to consider other options if the steep learning curve or poor integration hinders your team’s efficiency.
- Customization and scalability: As your business grows, so will your monitoring needs. You’ll want a tool you can customize to your evolving requirements and scale efficiently.
If any of these points resonate with your current situation, exploring a top New Relic alternative could help you optimize your monitoring capabilities and overall business operational excellence.
15 New Relic Alternatives That’ll Transform Your Observability And Monitoring
Consider the following options.
AppDynamics
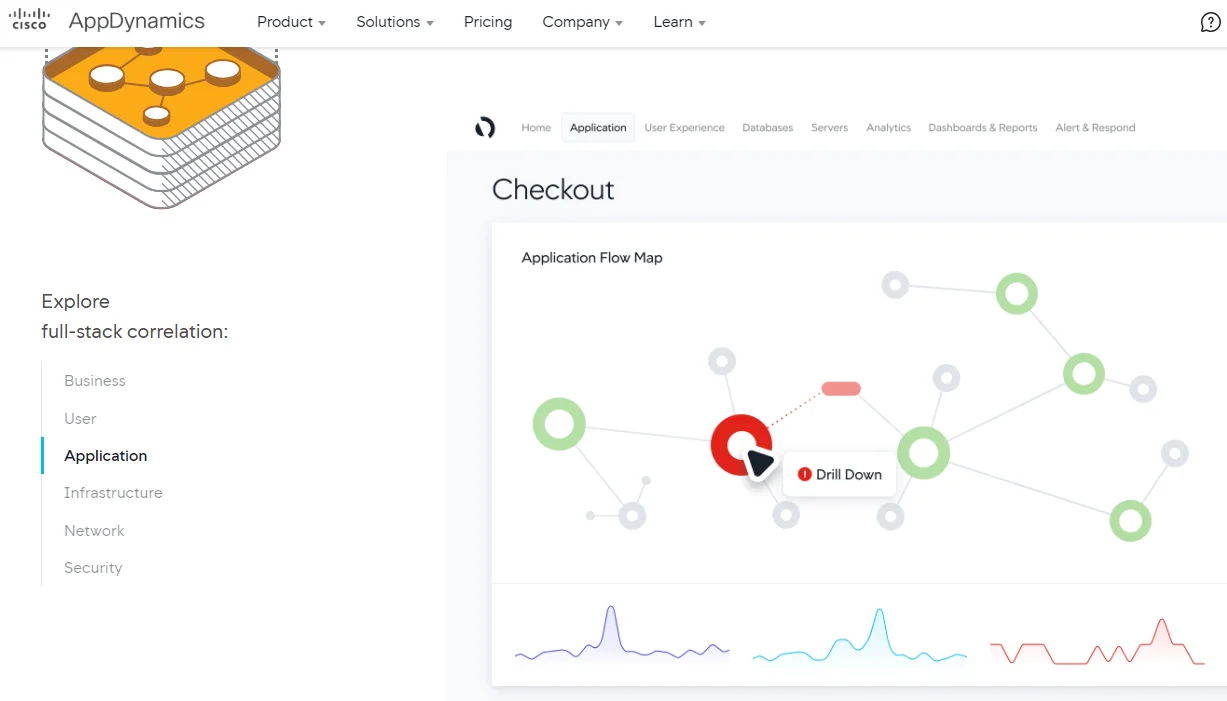
In particular, AppDynamics stands out from New Relic for providing detailed insights into application performance monitoring (APM) at the code level. It offers robust application mapping, predictive capabilities, and automated remediation features. More importantly, it connects technology insights and business outcomes, like revenue and customer experience.
The platform excels in offering real-time code-level diagnostics, enabling users to pinpoint specific lines of code or modules causing performance issues. This fosters more effective debugging and optimization.
AppDynamics pros
- Business-centric approach eases decision-making
- Full-stack monitoring platform
- Excellent, code-level APM even for complex applications
- Seamlessly integrates with various technologies and platforms
- Works great on-premises and as a third-party SaaS
AppDynamics cons
- Like New Relic, AppDynamics can have a considerable learning curve
- Complex pricing
AppDynamics pricing
AppDynamics pricing depends on the specific service you choose. For example, it charges $6 per month per CPU core for the standalone infrastructure monitoring edition. Meanwhile, AppDynamics Observability costs $50 per month per license and $30 per month per license for AppDynamics Observability and Modules (1 APM service or instance per month). See more here.
AppOptics

AppOptics, a SolarWinds product, is distinct for its infrastructure monitoring and cloud services. It delivers comprehensive insights into infrastructure performance, including server monitoring, cloud services monitoring, and network performance analysis.
Additionally, AppOptics stands out for its seamless integration with various cloud platforms and technologies. This makes it a preferred choice for organizations heavily reliant on cloud services.
AppOptics pros
- Comparatively less complex than New Relic
- Full-stack visibility that’s more affordable
- Excellent infrastructure monitoring
- Superior integrations support (over 150)
- Highly scalable whether in the cloud or on-premise
AppOptics cons
The level of customization and data analysis may be limited compared to more comprehensive tools like New Relic.
AppOptics pricing
Starts at $9.99 per host, per month. AppOptics sells this in packs of 10 hosts, and 100 containers.
Azure Monitor
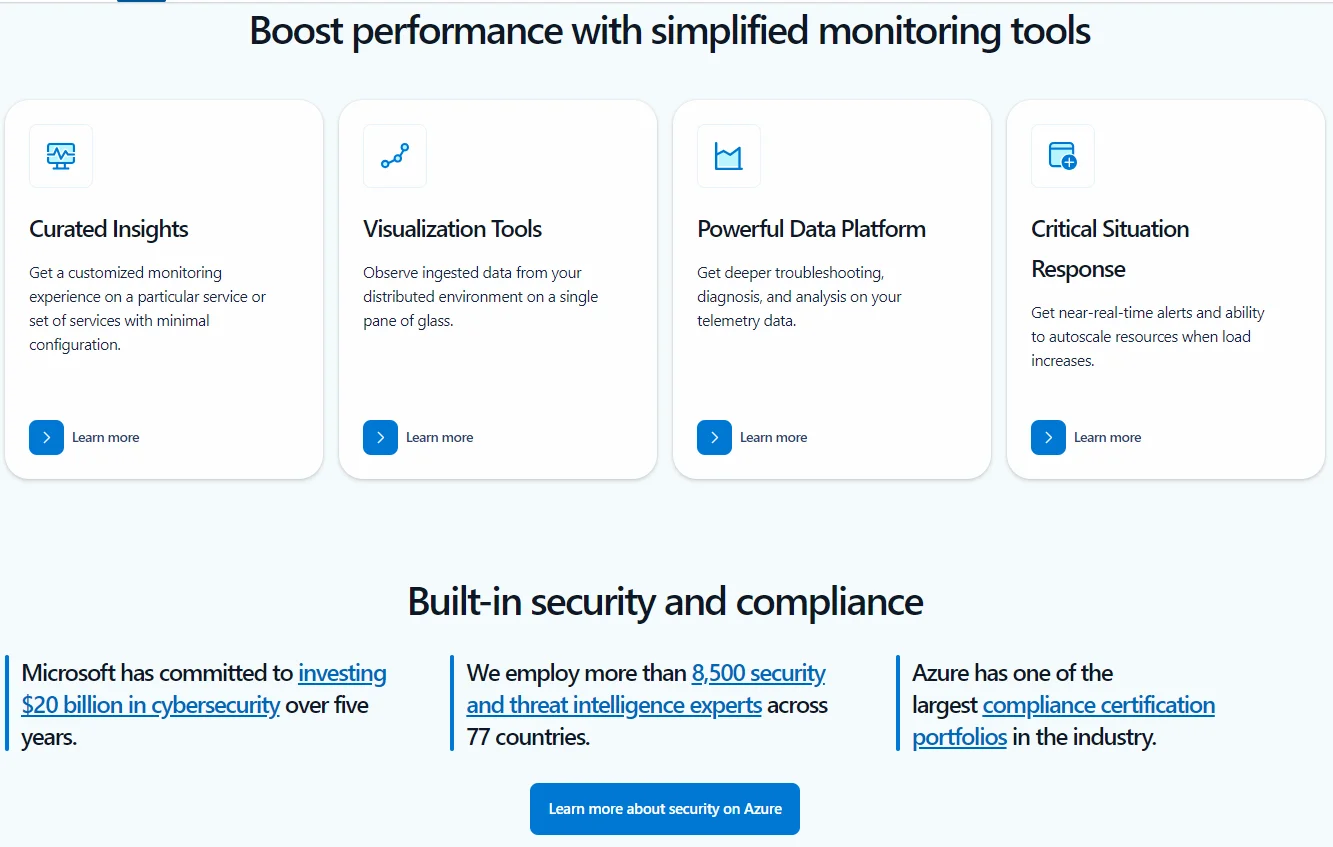
Azure Monitor is particularly ideal for analyzing and optimizing web applications and infrastructure performance within the Microsoft Azure ecosystem. It provides comprehensive monitoring of essential Platform as a Service (PAAS) services that other tools may not support.
Azure Monitor allows users to monitor Linux and Windows virtual machines, Azure Kubernetes Service (AKS), Azure Storage, and databases on a single map, offering a holistic view of the entire infrastructure.
Azure Monitor pros
- Robust infrastructure, network, and applications monitoring
- Deep integration with Azure hence suitability to Azure environments and use cases
- Supports multi-cloud and hybrid cloud monitoring
- Centralized logs and distributed tracing support
Azure Monitor cons
Its primary focus on Azure means it may not be as effective or comprehensive for monitoring non-Azure environments.
Azure Monitor pricing
Pricing is pay-as-you-go based on the volume of data you ingest into Azure Monitor. However, you can use reserved instances to save up to 36% off the pay-as-you-go (On-Demand) rate.
CloudZero
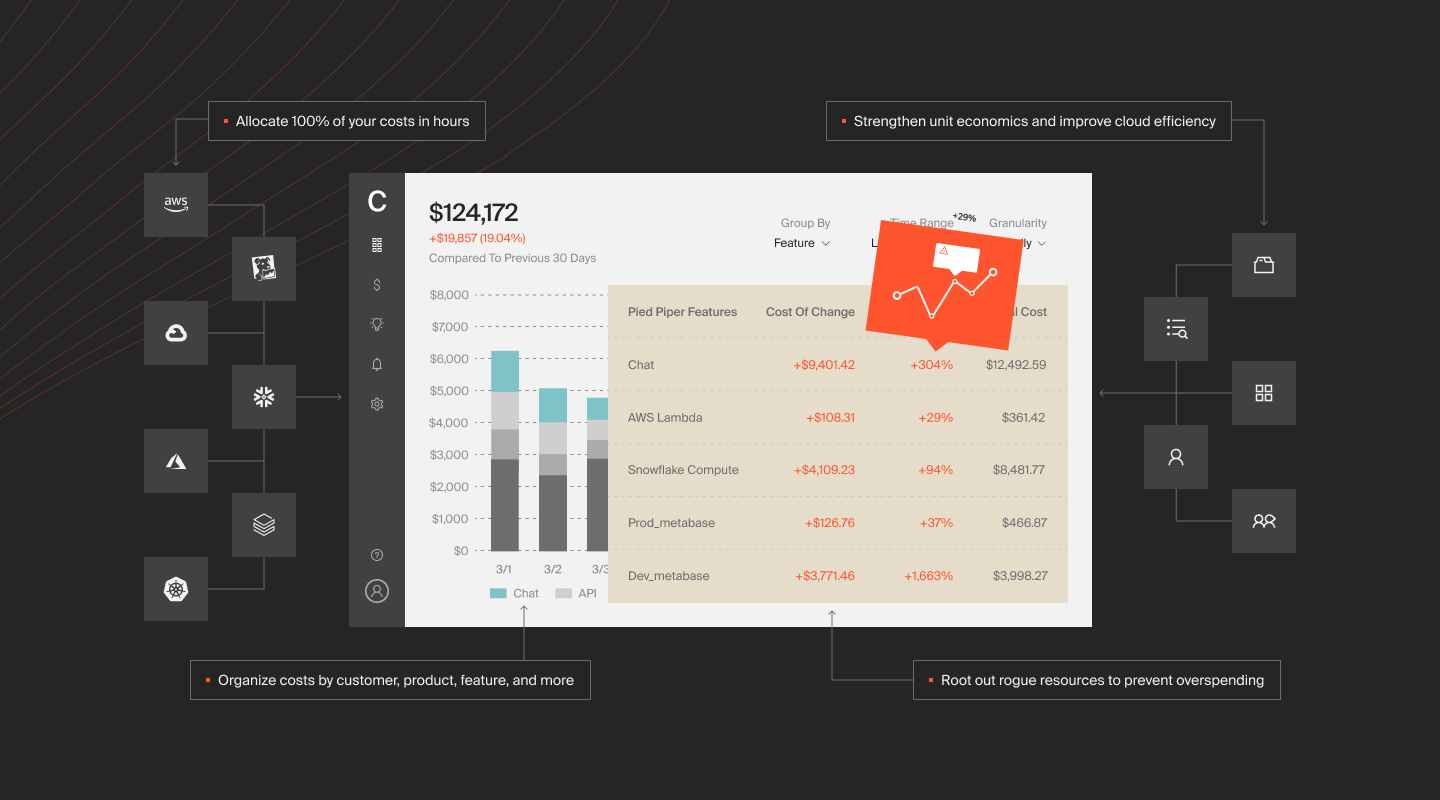
Unlike New Relic, which concentrates on application performance and system health, CloudZero presents a unique approach to monitoring by specializing in cost intelligence for cloud environments. This specialization makes CloudZero particularly valuable for businesses looking to optimize cloud spending.
With CloudZero, you can zoom in and out of the financial aspect of your cloud usage to understand how resource utilization is reflected in costs. This way, your cloud costs are tied to specific people, products, and processes. As a result, you can determine where to optimize usage to minimize unnecessary spending and where to invest more to maximize returns.
CloudZero pros
- Unlike most cost tools, CloudZero delivers granular, immediately actionable cost intelligence, such as Cost per Customer, Cost per Feature, and Cost per Team
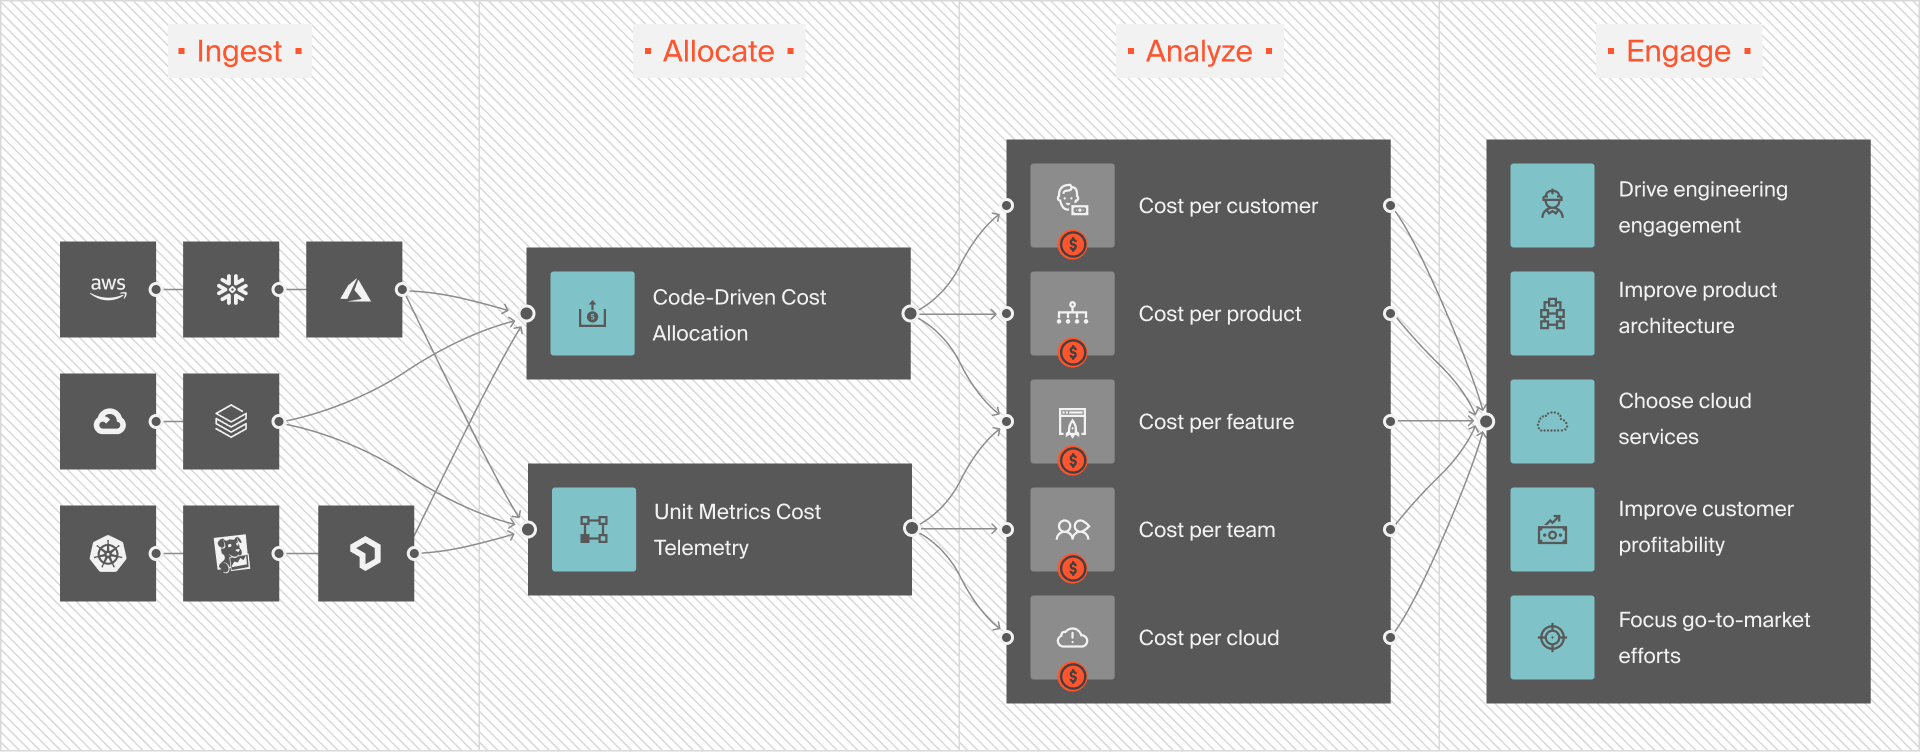
- Engineering-Led Optimization approach ensures that tech teams align with finance and FinOps teams to optimize cloud costs
- Allocates 100% of your cloud spend no matter how complex your environment is or how messy your tags are
- Use unit cost metrics like Cost per Customer to set profitable pricing and discounts
- Offers category-leading Kubernetes cost analysis, from Cost per Pod to Cost per Environment
- Delivers timely, noise-free, and contextual cost anomaly alerts to help prevent surprise costs
CloudZero cons
For traditional cloud cost management approaches, such as committed use discounts, CloudZero might not be it. CloudZero, however, offers a unified dashboard for managing discount programs in partnership with ProsperOps (automated RIs management) and Xosphere (Spot Instance orchestration).
CloudZero pricing
With CloudZero, pricing is flexible, tier-based, and not based on a percentage of your savings or cloud spend. In addition, CloudZero customers typically recoup their investment within three months. Take a product tour here or schedule a demo here to see CloudZero in action for yourself.
Datadog
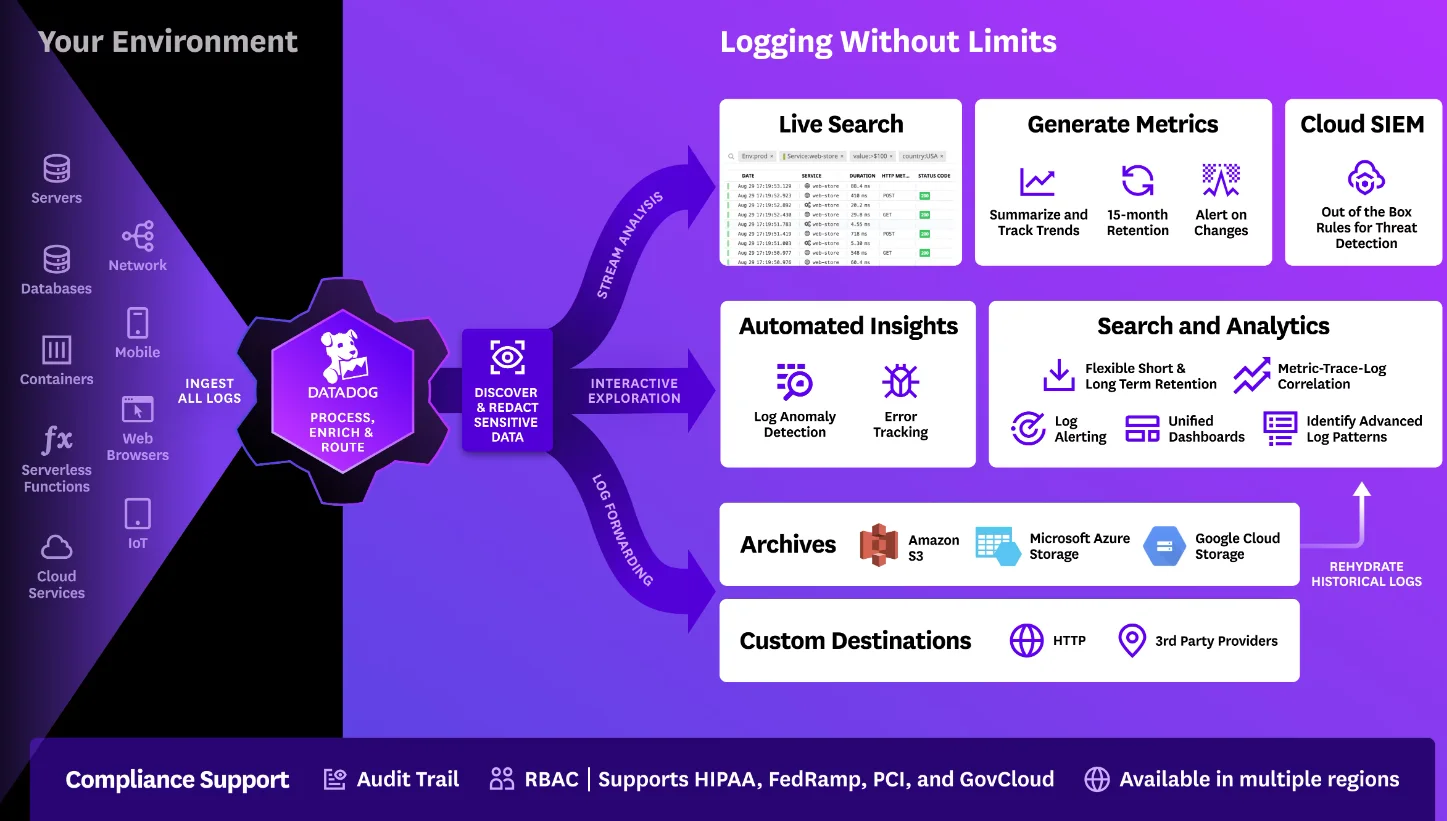
Datadog offers exceptionally comprehensive monitoring capabilities, catering to a similar (probably wider) array of IT infrastructure needs compared to New Relic. Datadog’s suite includes network performance monitoring, log management, and security monitoring. Its robust analytics and alerting systems also positions Datadog as a versatile and scalable option.
This is especially suitable for businesses seeking an integrated overview of their entire operational landscape.
Datadog pros
- Full-stack observability platform
- Highly scalable, so it’s ideal for enterprise applications
- Robust log management
- Thorough analytics that support in-depth root cause analysis
- Automated tagging, correlation, and contextual log data
- Real-time monitoring
- Robust anomaly detection and alert system
Datadog cons
- Charging based on peak usage compared to New Relic’s actual usage pricing
- Its host-based pricing is expensive (for example, custom metrics start at $0.05 per custom metric per month)
- Steep learning curve
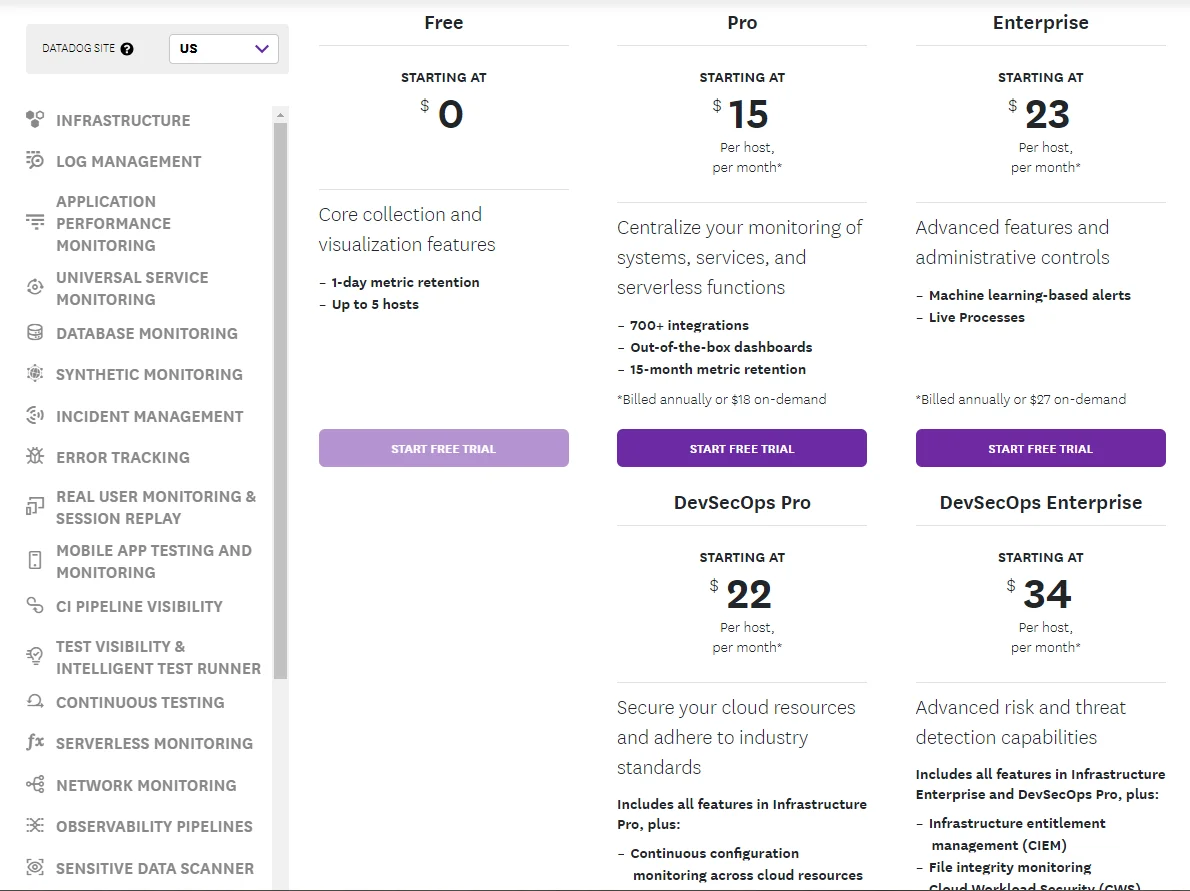
Datadog pricing
Datadog charges a separate fee for each monitoring service. For example, infrastructure monitoring starts at $15 per host per month while APM starts at $31 per host per month.
In many ways, Datadog is similar to New Relic. However, if you’re concerned about costs, check out our Datadog cost management guide for tips on optimizing them.
Dynatrace
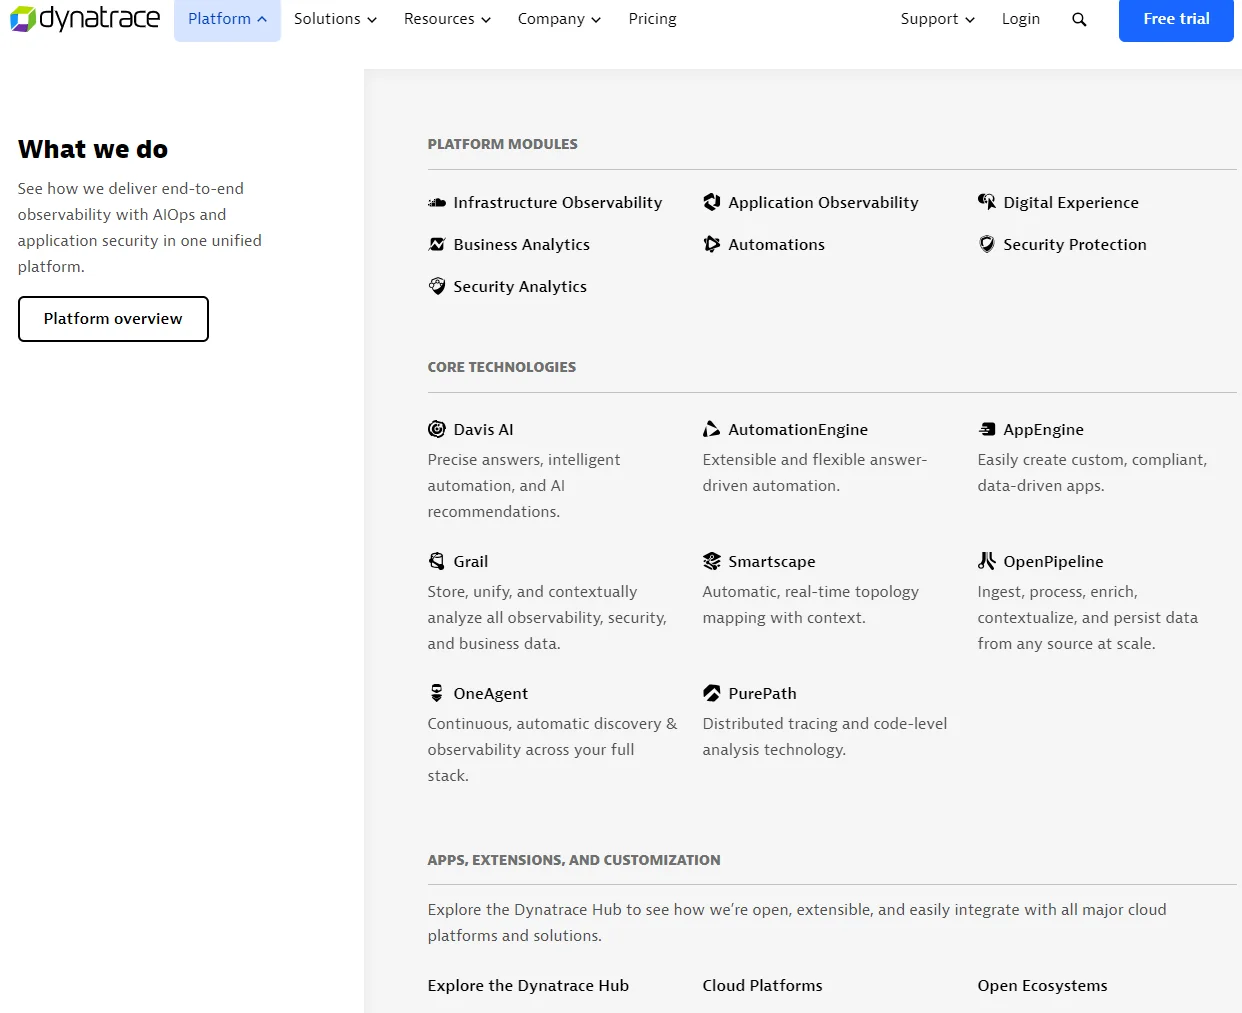
Dynatrace is also a full-stack observability platform, very similar to New Relic and Datadog. However, Dynatrace is known for its AI-driven root cause analysis. This ensures you can automatically detect anomalies and dependencies across your full stack at any scale.
This AI-driven approach enables Dynatrace to provide more precise, real-time insights and proactive problem resolution, significantly reducing the time and effort your team needs for manual troubleshooting.
Dynatrace pros
- Superior AI-powered observability
- Full-stack monitoring solution, from infrastructure and APM to server and digital experience monitoring
- Robust automations
- Emphasizes security analytics and protections
- Supports building your own tools to extend its capability
Dynatrace cons
- Complaints of below-par documentation
- Can be pricey
Dynatrace pricing
Dynatrace charges per hour, session, or request, depending on the specific service you use. For example, you’ll pay $0.08 per hour for an 8 GiB host (full stack monitoring), $0.00225 per hour for real user monitoring, and $0.001 per synthetic request (synthetic monitoring).
Grafana
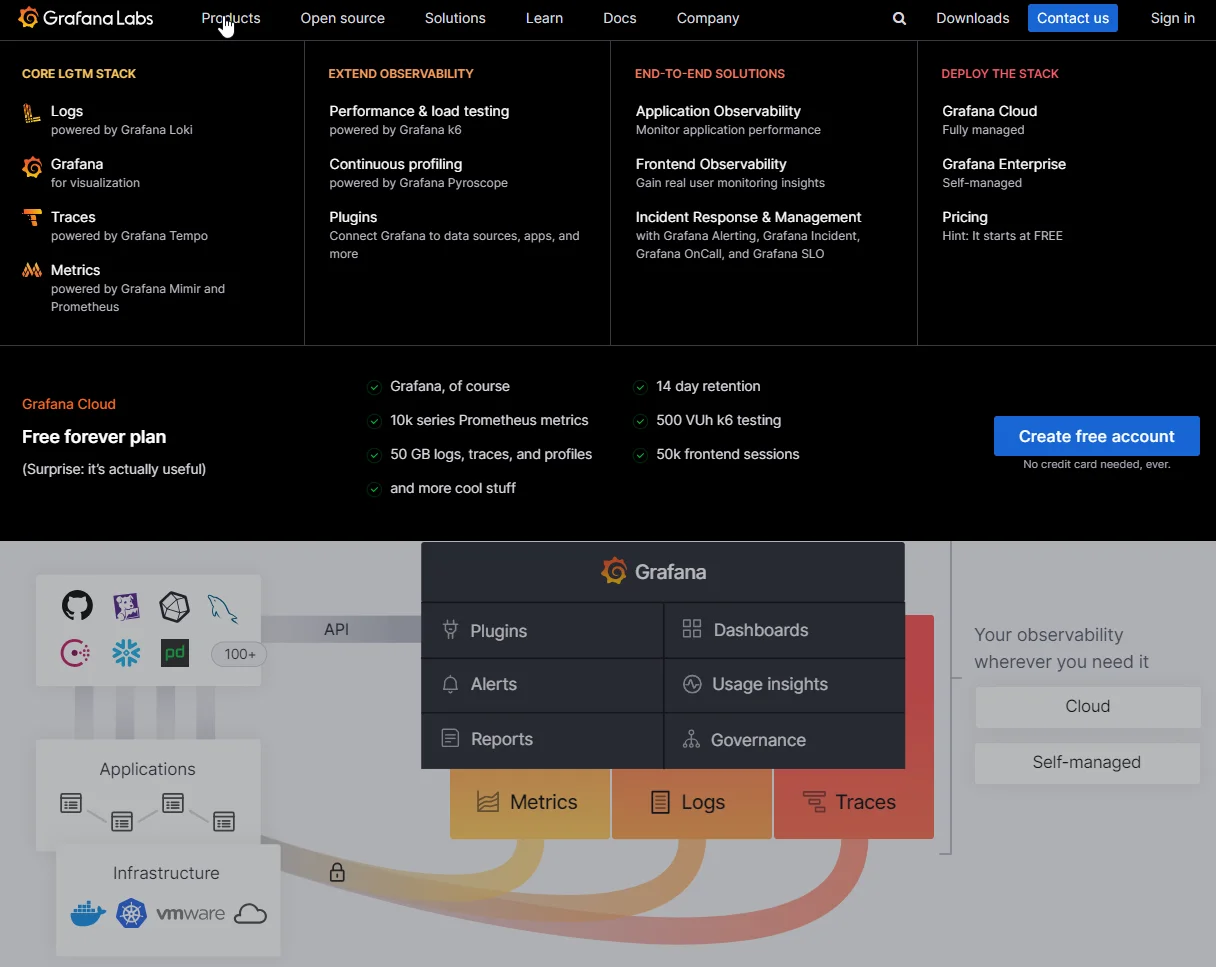
Grafana is best known for its visualization capabilities, and when paired up with Prometheus, is a solid part of an open-source monitoring stack. It specializes in creating highly customizable dashboards that bring data from multiple sources together in an easily digestible format.
Its ability to integrate with a wide range of databases and monitoring tools (including New Relic itself) makes it exceptionally versatile.
Grafana pros
- Solid for insightful visualizations of complex datasets
- Compatible with a wide variety of data sources
- Open-source for teams wanting to build their own observability stack vs New Relic
- Customizable dashboards
- Extensive integration options
- Robust alerting system with support for email, Slack, and other notification channels
Grafana cons
- Despite its excellent visuals, it lacks the more comprehensive monitoring and analytics features of platforms like New Relic
- For complete monitoring solutions, Grafana often needs to be paired with other tools, potentially adding complexity to a tech stack
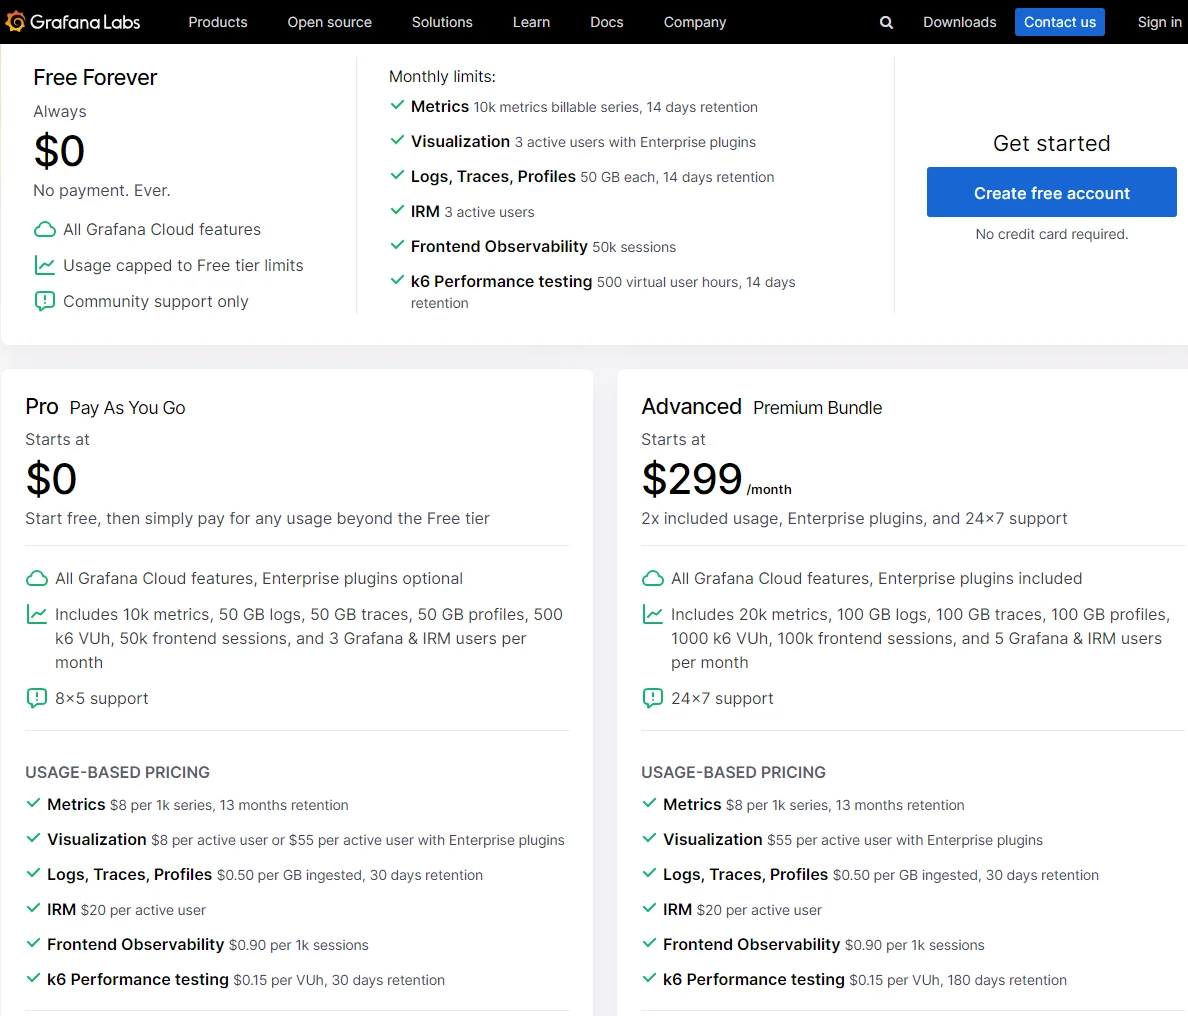
Grafana pricing
Both Grafana and Grafana Cloud start with a free forever plan. Beyond the free tier, pricing is usage-based, running up to $299 per month for the advanced premium bundle. Picture this:
Honeycomb
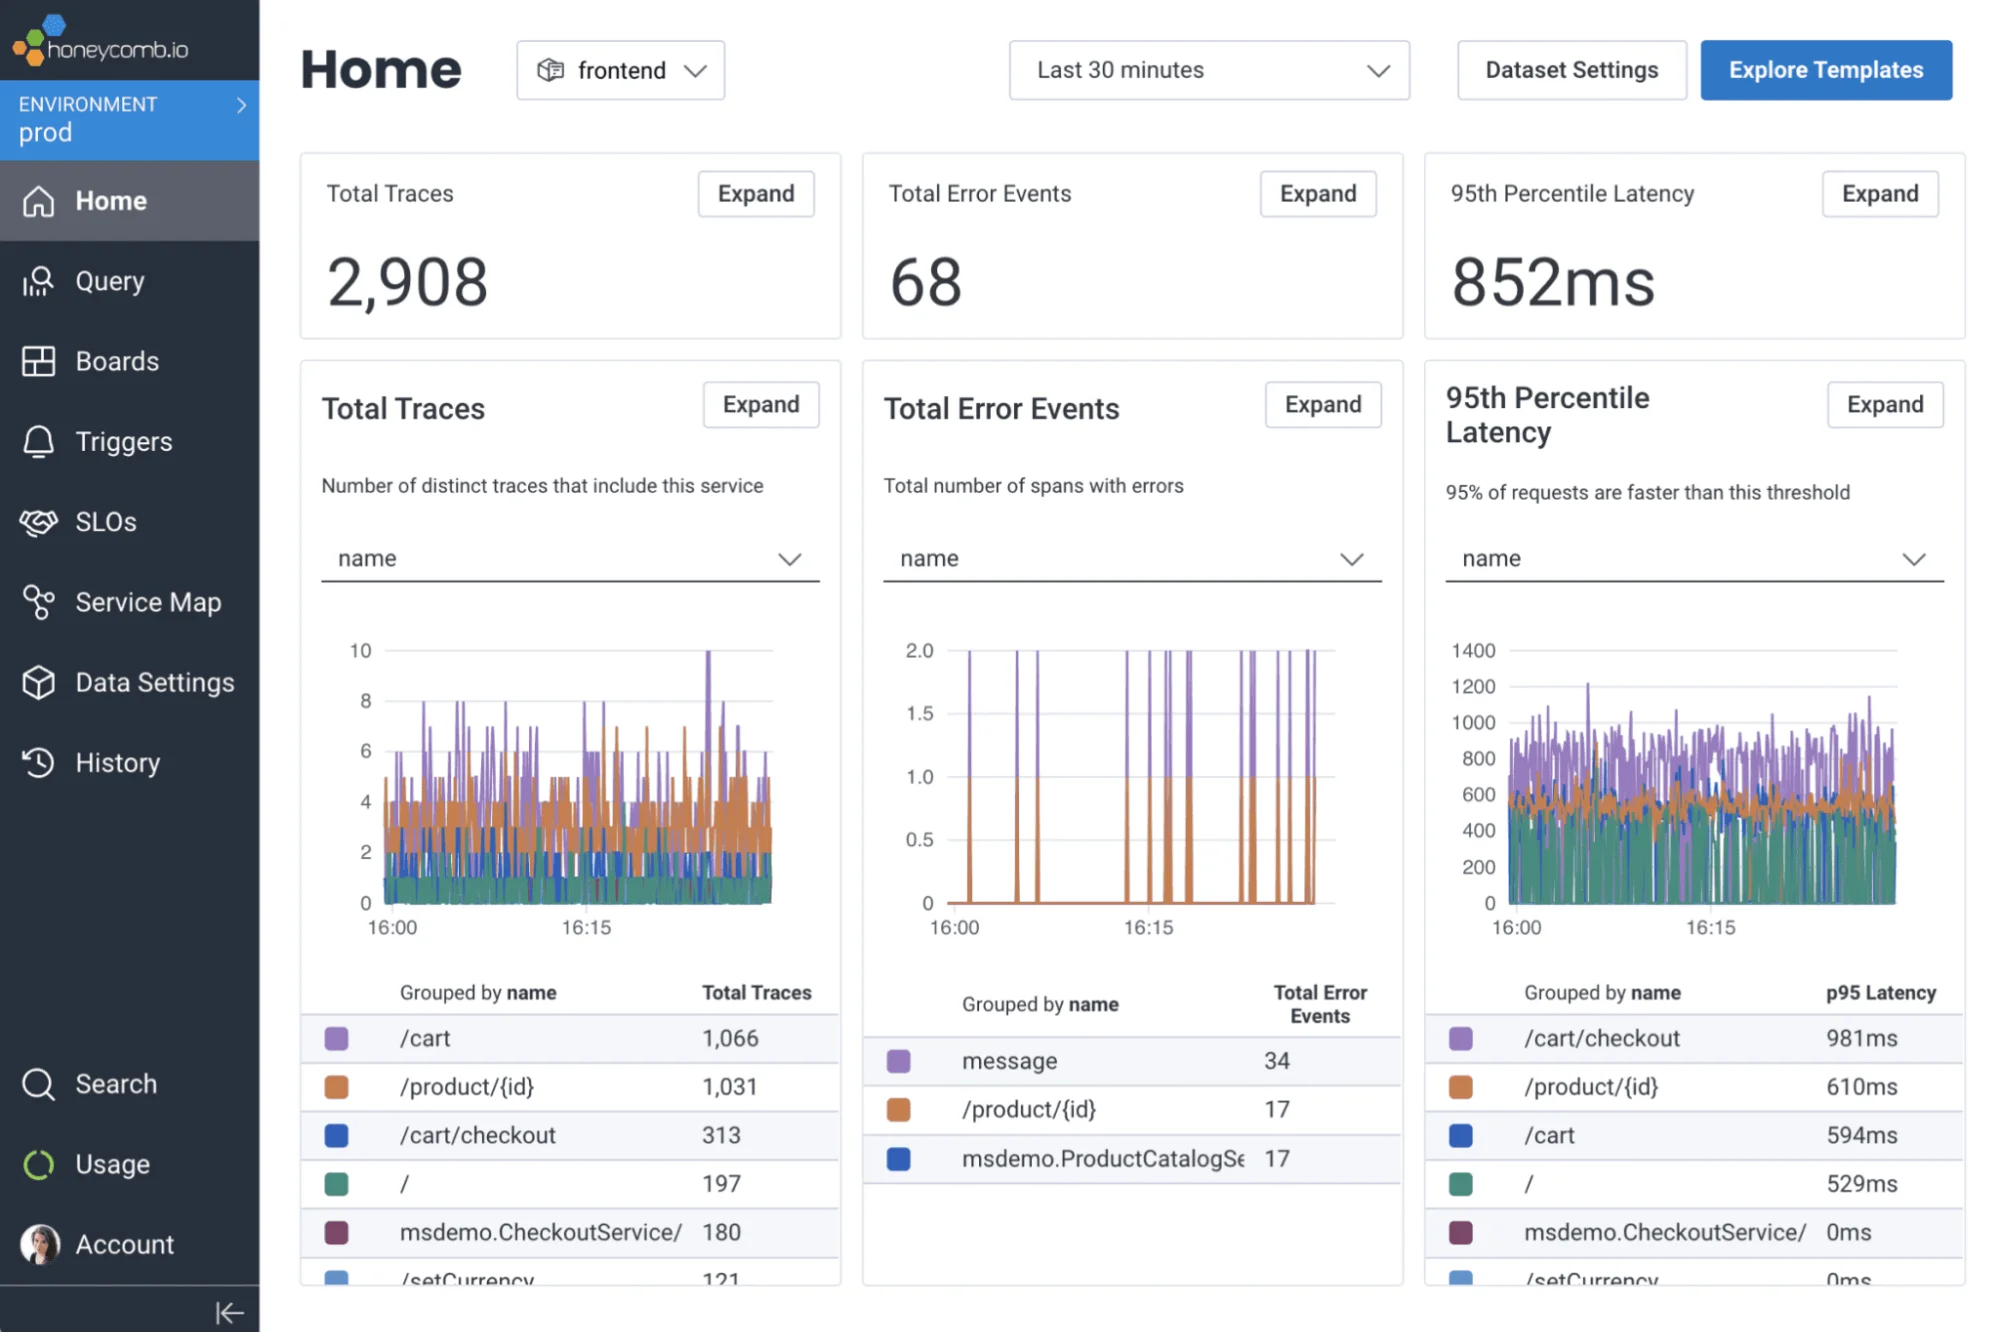
Honeycomb is designed for observability across complex, distributed systems. The platform is particularly ideal for understanding and debugging software behavior in production. Honeycomb also offers high cardinality data exploration and real-time streaming insights. This can help your team dissect and comprehend how your systems behave under various conditions —even at large scale.
Honeycomb pros
- Excels in scenarios that demand detailed, on-the-fly analysis of vast, varied data sets
- Suitable for mobile applications, such as microservices and containers
- Provides deep analysis within minutes
- Provides granular insights into system behavior in production
Honeycomb cons
- Compared to more established tools like New Relic, Honeycomb might offer fewer integrations out-of-the-box, potentially necessitating additional configuration or development work
- Honeycomb is primarily designed for engineering teams, and its utility might not extend as comprehensively to other business areas, unlike broader monitoring platforms
Honeycomb pricing
Expect event-based pricing; Honeycomb charges you based on the number of events you send it. After the free tier’s 20 million events, the Pro plan starts at $130 per month for 100 million, 450 million, or 1.5 billion events per month.
IBM Instana Observability
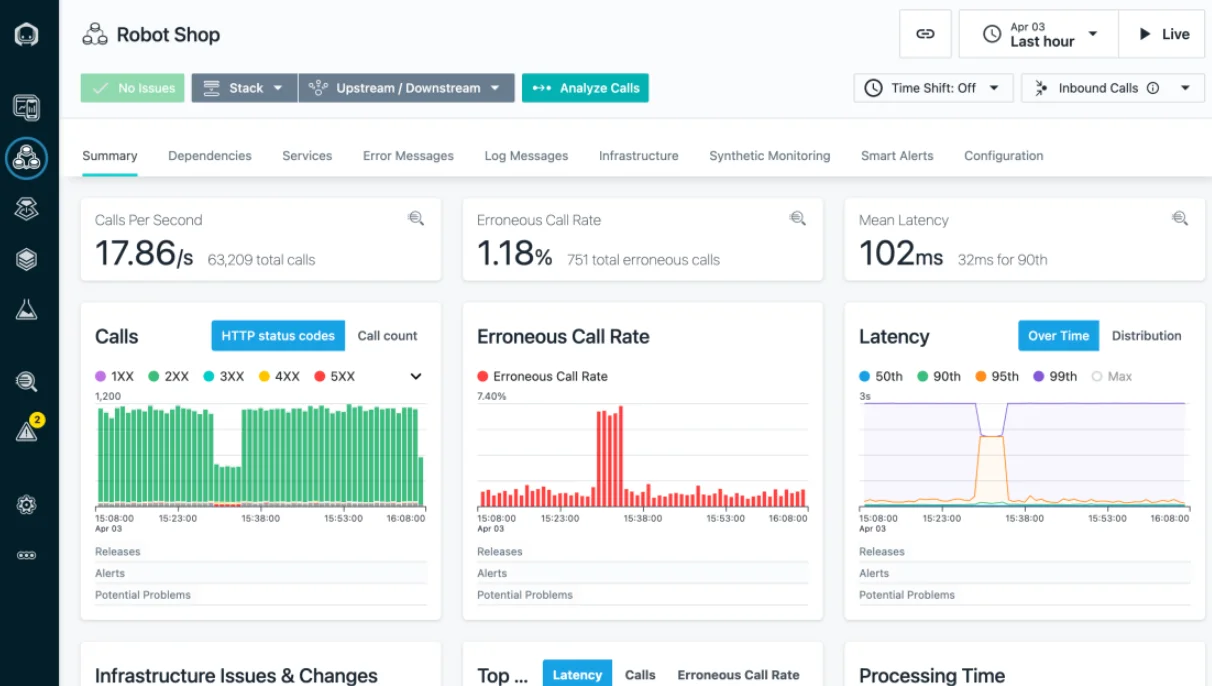
Instana’s unique selling point is its ability to automatically detect and monitor not just applications, but also underlying infrastructure and interdependencies within microservice environments.
This automatic and continuous discovery feature provides an in-depth, up-to-date view of your system’s state. This makes IBM’s Instana highly efficient for monitoring dynamic and complex environments.
IBM Instana Observability pros
- Ideal for complex, modern architectures like microservices, Kubernetes, and cloud-native environments
- Automated, real-time monitoring without sample tracing
- Deep insight into system dependencies, which is handy for troubleshooting issues
- Supports hybrid cloud monitoring (IBM, AWS, Azure, GCP)
- Solid log management and distributed tracing
IBM Instana Observability cons
- May have limited infrastructure and database monitoring compared to New Relic
- Can be more expensive than New Relic
IBM Instana Observability pricing
Pricing for Instana Observability uses per-host pricing. Pricing factors include the type of Instana edition you choose (SaaS or Self-hosted), the number of APM hosts, and the number of infrastructure quality management hosts you choose.
ManageEngine Applications Manager
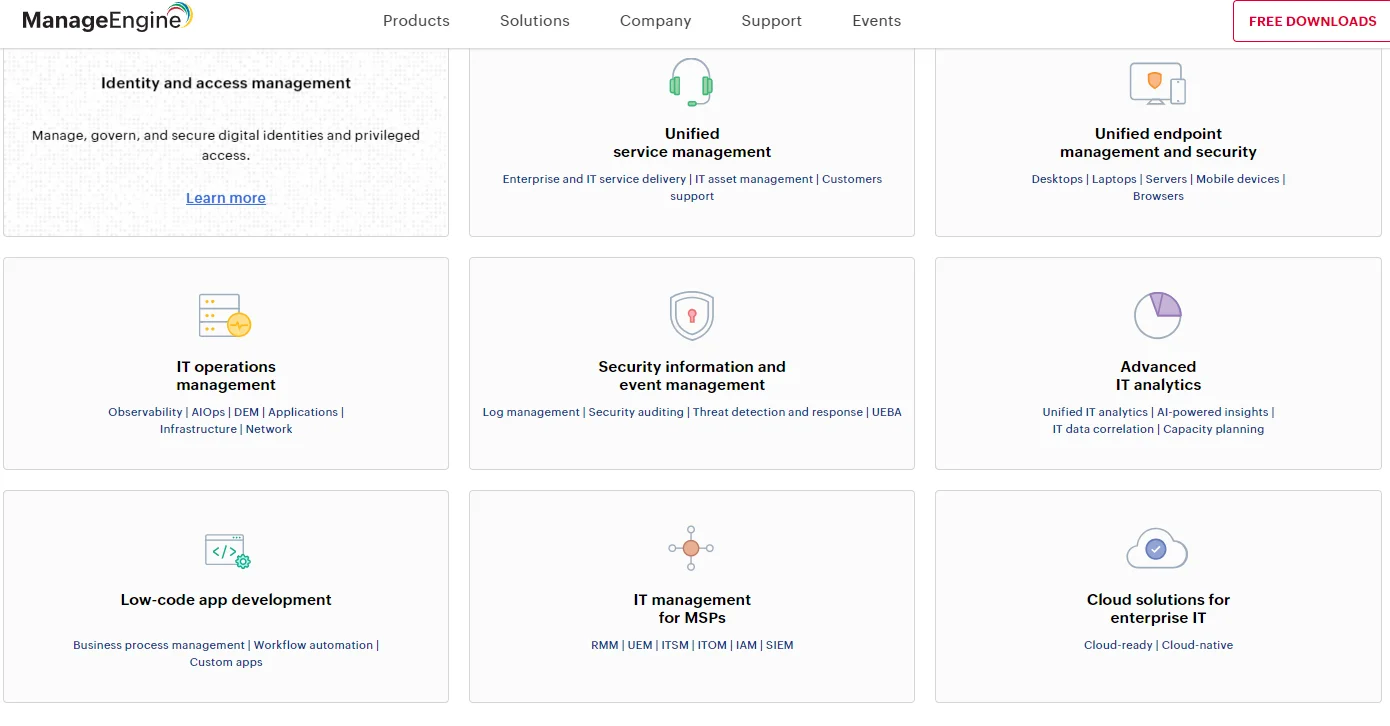
ManageEngine Applications Manager offers a robust application performance management solution that includes end-user experience management for enterprise internet services and hosted web services. Yet, it is user-friendly and less expensive than New Relic. This makes it attractive to small and medium-sized organizations as well.
ManageEngine Applications Manager pros
- Combines affordability with broad observability capabilities
- Emphasizes security monitoring
- Supports low-code app development to improve its functionality
- Unifies service management
- Its architecture uses no collectors or agents, reducing complexity
ManageEngine Applications Manager cons
- It may not be as comprehensive as New Relic, especially for user and infrastructure monitoring
ManageEngine Applications Manager pricing
Custom pricing. Needs you to get a quote.
Sematext
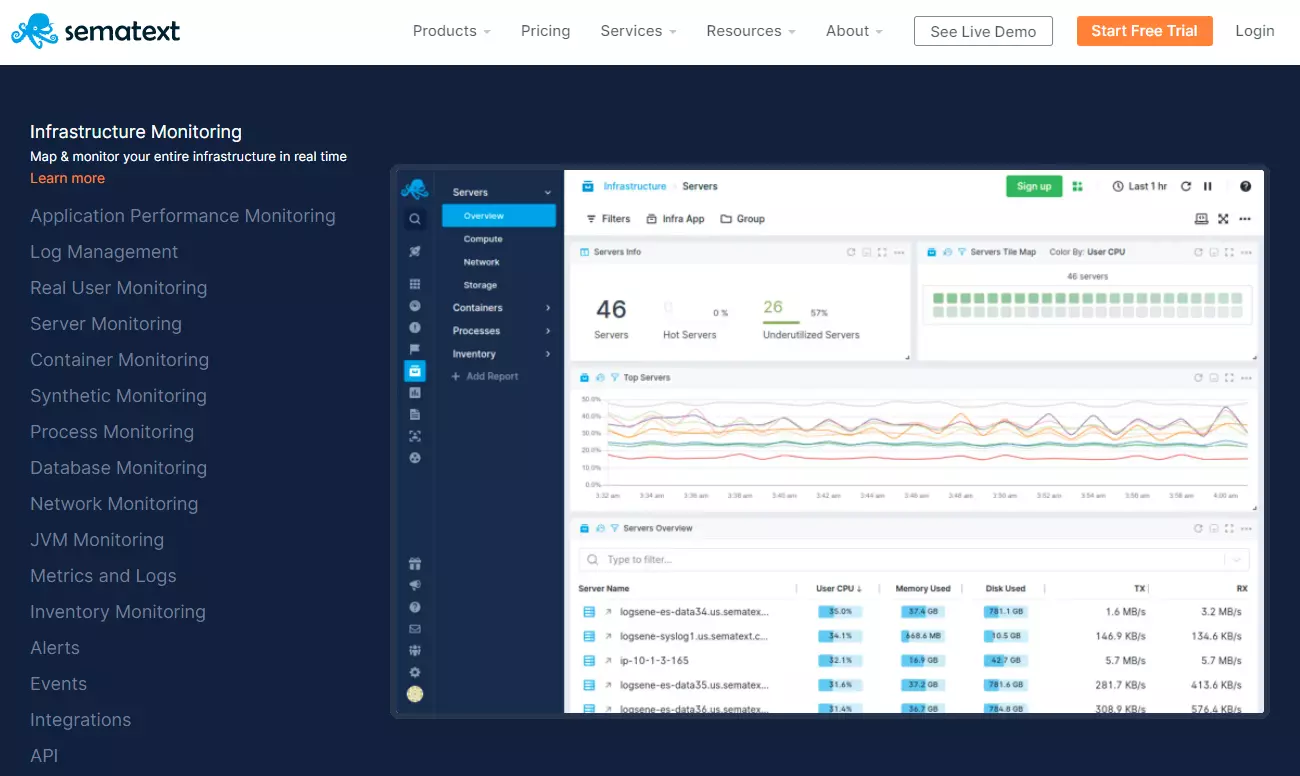
Unlike New Relic, Sematext is budget-friendly without compromising log management, real user monitoring, synthetic monitoring, and infrastructure monitoring quality. Also, its out-of-the-box dashboards and real user monitoring features make it a valuable tool for DevOps and SREs looking for a cost-effective yet powerful observability solution.
Sematext pros
- Takes minutes to install
- Robust real-user monitoring
- Cost-friendly alternative to New Relic
- It’s web monitoring includes tracking Core Web Vitals
- Fully managed Elasticsearch and Kibana
Sematext cons
- Support for distributed tracing is limited
- Log filtering capabilities are limited
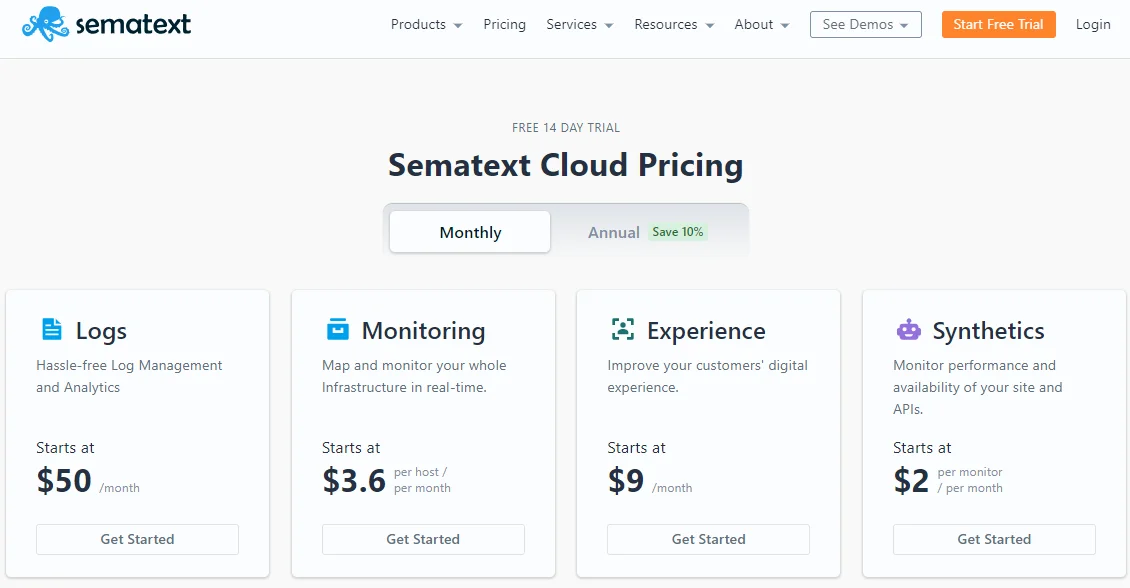
Sematext pricing
For up to 5 hosts, Sematext is free (Basic plan). Pricing for log management begins at $50 per month, and for synthetic monitoring, it begins at $2 per HTTP monitor and $7 per browser monitor.
Sentry

Sentry makes a strong alternative to New Relic, particularly for its code code-level diagnostics. You can use it to track error trends and analyze root causes at the code and infrastructure levels. Sentry serves you best for application error monitoring, end-user experience monitoring, and efficient bug tracking and issue management. It also includes a user-friendly interface to simplify issue tracking and resolution in a centralized platform.
Sentry pros
- Real-time monitoring capabilities
- Custom dashboards
- Seamless integration with popular tech stacks
- Comprehensive error-tracking solutions
Sentry cons
- Limited infrastructure compared to New Relic
- Sentry’s detailed error tracking can result in a significant amount of data, which can become overwhelming to manage and might require additional filtering and management efforts
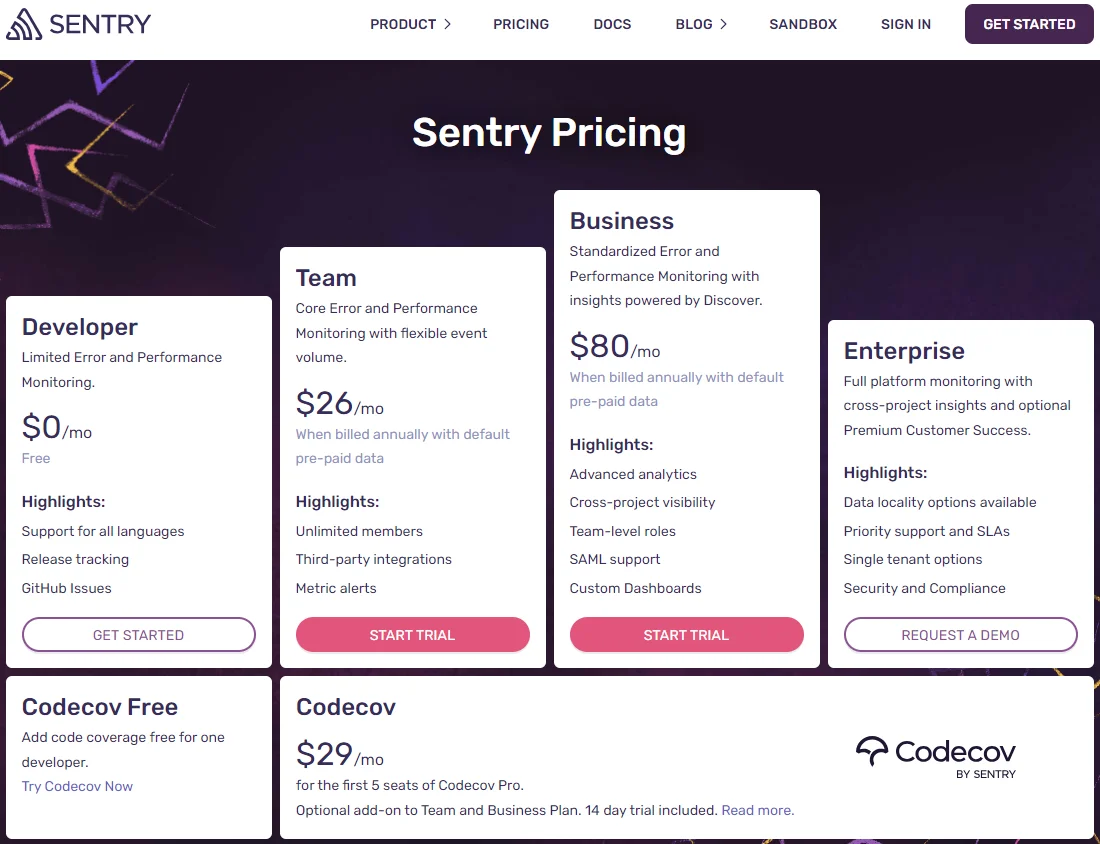
Sentry pricing
Developers can use Sentry for free up for limited error tracking performance monitoring. Paid plans start at $29 per month (billed annually).
SolarWinds Server & Application Monitor
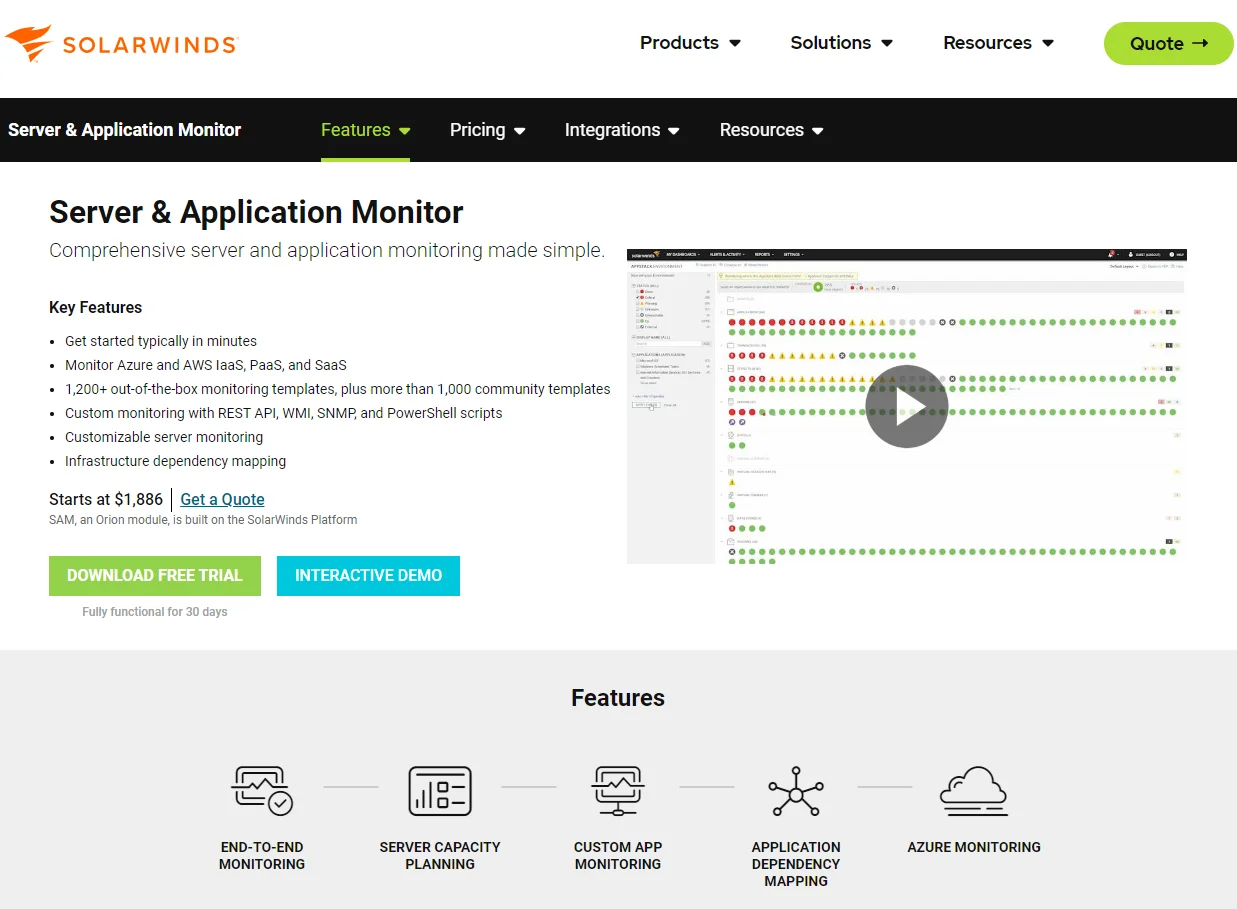
SolarWinds SAM focuses on server health, application monitoring, and network device tracking within one platform. This provides your team with a more holistic view of your IT infrastructure components compared to AppOptics. With AppOptics, the emphasis is on detailed application performance metrics, distributed tracing, and cloud-native monitoring capabilities.
SolarWinds SAM pros
- Monitors server health alongside APM
- Includes robust network monitoring
- Less expensive than New Relic
- Quick installation
- Observability across IaaS, PaaS, SaaS, Azure, and AWS
- Dependency mapping (infrastructure)
SolarWinds SAM cons
- Some users may find SAM’s interface slow, impacting the user experience when navigating and accessing data
SolarWinds Server & Application Monitor pricing
Server and Application Monitor starts at $1,886.
Splunk
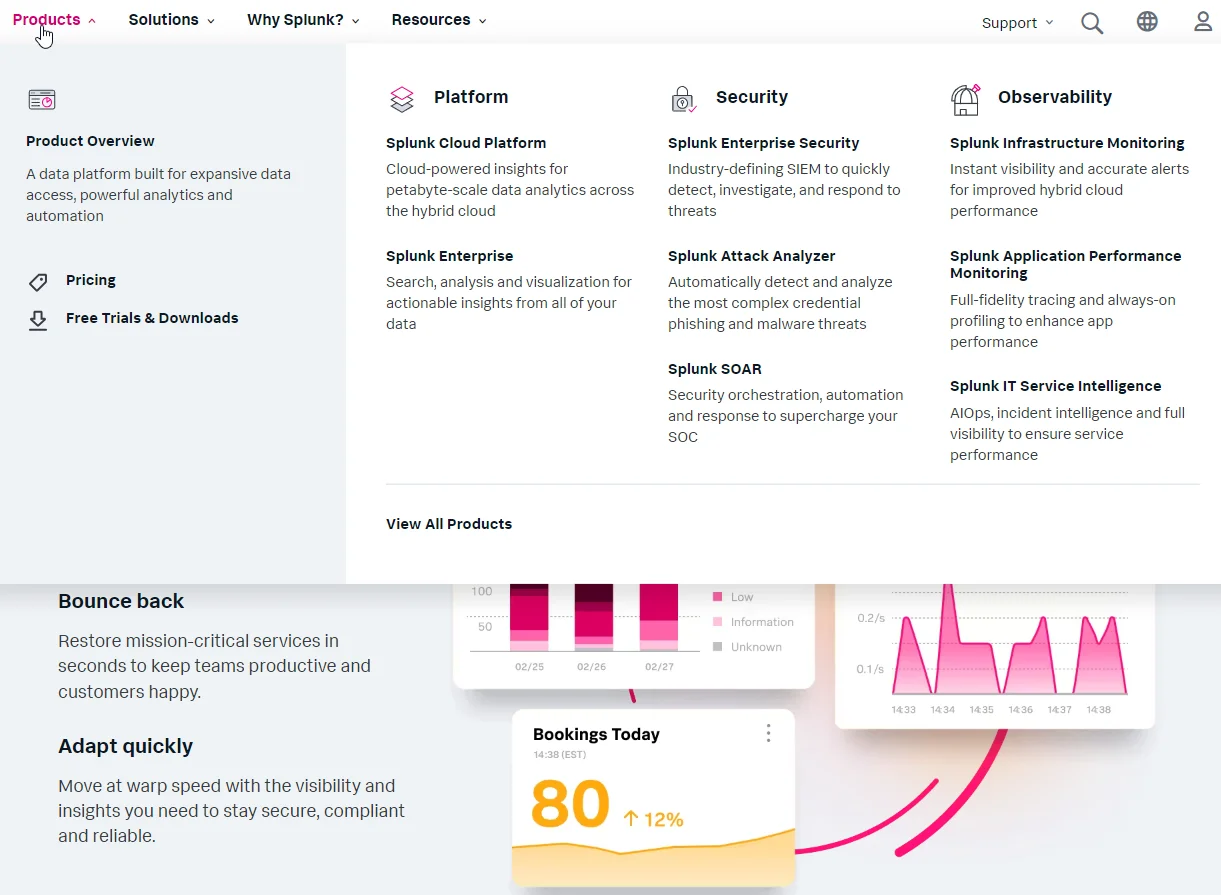
Like AppDynamics, Splunk is also a Cisco company. Splunk differentiates itself from New Relic (and AppDynamics) with its powerful focus on data analytics and log management. It ingests and analyzes massive volumes of data, particularly logs, to provide actionable insights across various aspects of your business. Splunk is best used in environments where there is a need to analyze and make sense of large quantities of log data or unstructured data, particularly for security and compliance purposes.
Splunk pros
- Petabyte-scale data analytics
- Hybrid cloud support
- Sends alerts by urgency to minimize downtime
- Robust log management (quite like New Relic)
- AI-powered threat detection
Splunk cons
- Can be relatively expensive compared to New Relic, which offers a free edition with a monthly data ingestion cap
- Some users may find Splunk’s interface and query language (SPL) challenging to get used to, although it offers powerful data analysis capabilities once you master it
Splunk pricing
Expect activity-based (sessions, traces analyzed per minute, uptime requests, metric time series), workload (type of workload), ingest (amount of data ingested), and entity (number of hosts) pricing.
Sumo Logic
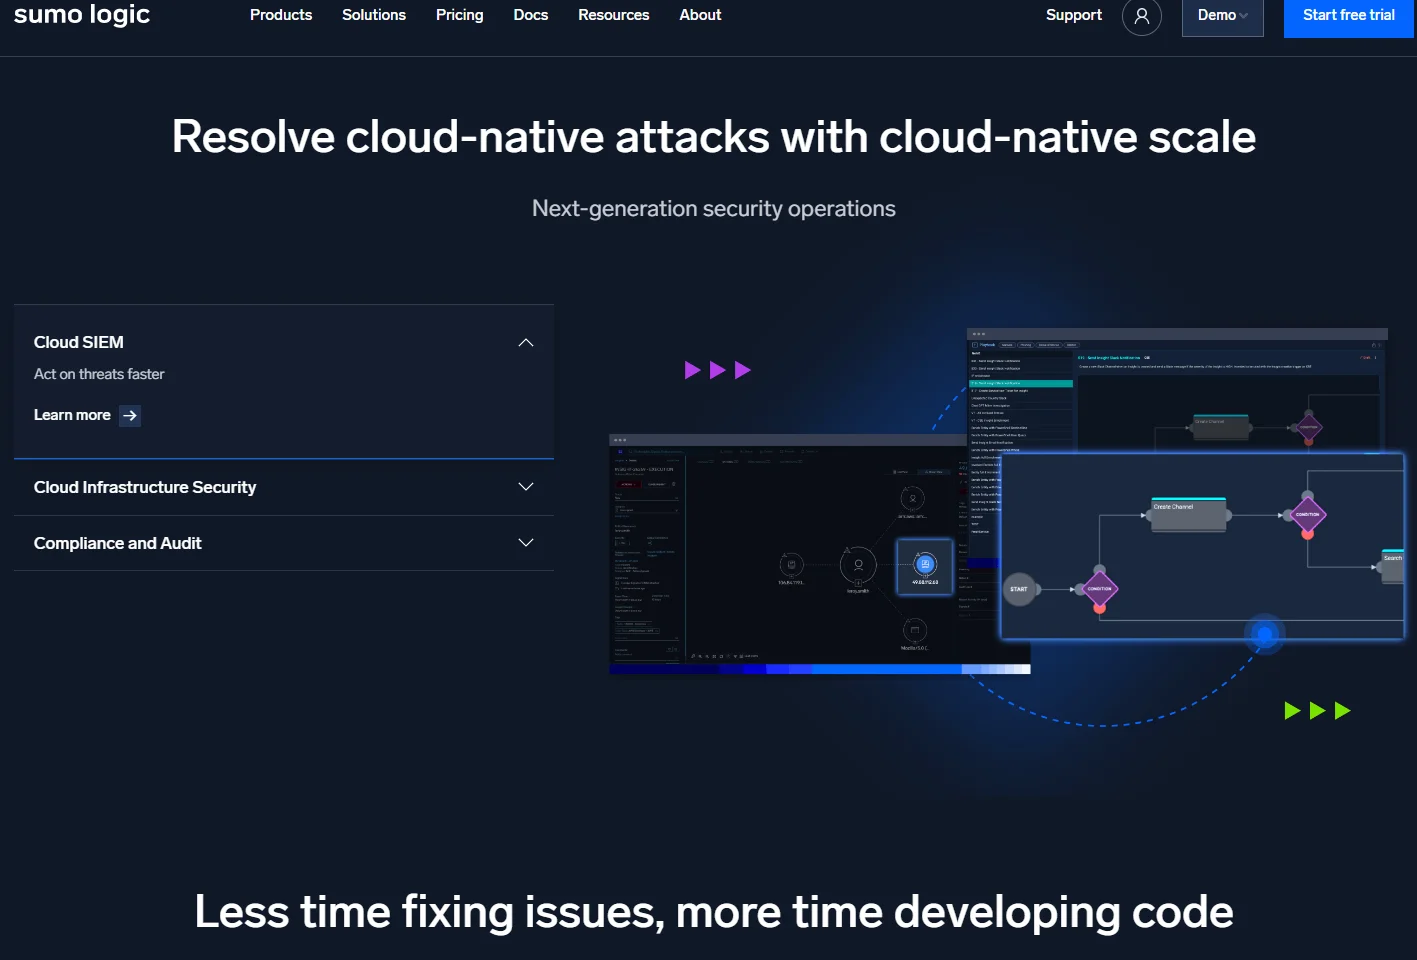
Sumo Logic emphasizes continuous intelligence through advanced log management and SIEM. You can use it to process and analyze large volumes of log data and metrics as well. This means Sumo Logic provides insights into security, compliance, and similar operational challenges.
Sumo Logic pros
- Cloud-native approach for modern IT environments
- Highly scalable architecture for enterprise-level use cases
- Excellent log analytics and management
- 30-day free trial (no credit card required either)
- Solid cloud SIEM and SOAR
Sumo Logic cons
- Can be quite pricey
- May require quite a bit of setting up and a learning curve
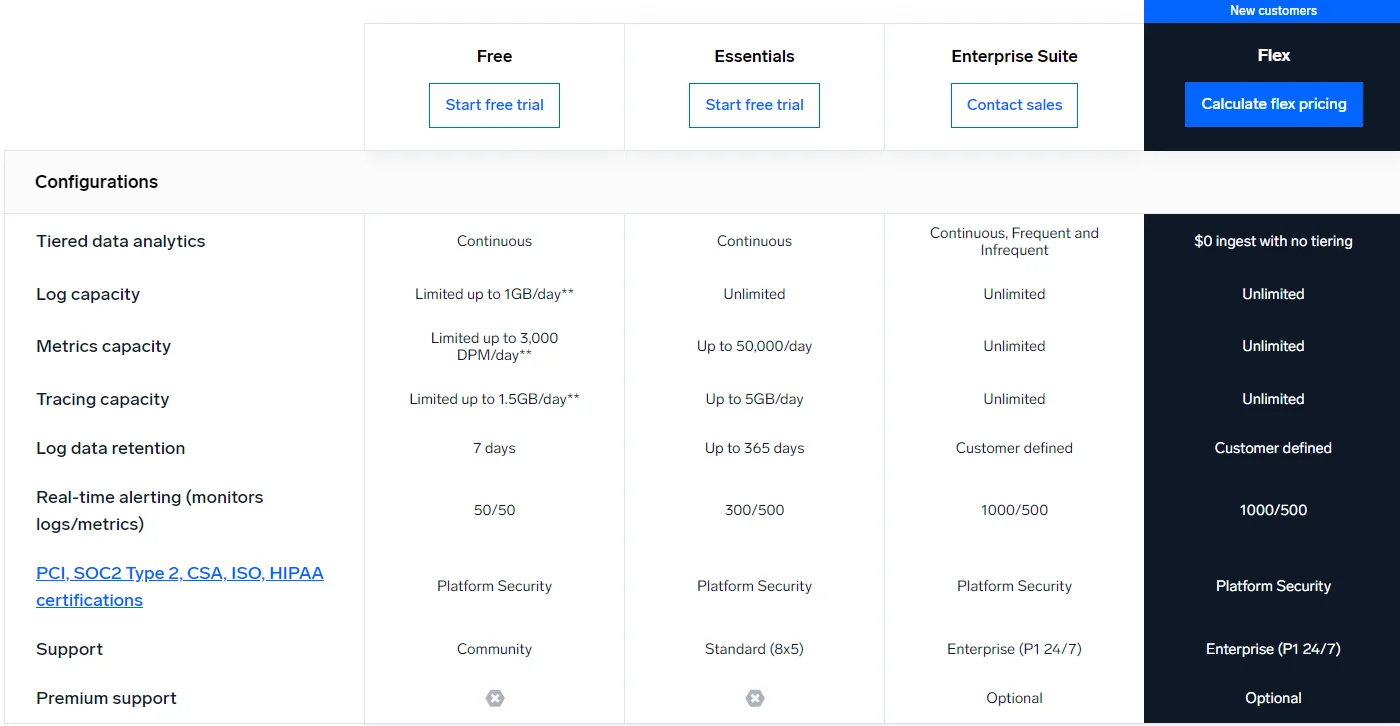
Sumo Logic pricing
Like some of the top New Relic alternatives, Sumo Logic pricing is based on the observability service you use. For example, ingest for logs is $0 (you only pay for insights).
What Next: Get Ahead Of Your Cloud Cost With Cloud Cost Intelligence
Now here’s the thing. Every alternative to New Relic generates mountains of data — and charges you for it. Left unchecked, this observability data can turn into hefty monitoring bills. CloudZero helps you visualize, understand, and optimize the costs of your monitoring solutions with precision.
With CloudZero, you can:
- Use telemetry to understand your New Relic, Datadog, and other monitoring costs – down to the hour and the specific people, products, and processes driving them, minimizing overspending.
- View your platform/monitoring tool costs alongside cloud spend across your infrastructure and apps (AWS, Azure, GCP, Oracle Cloud) providing a true single source of truth.
- Monitor your containerized and noncontainerized costs in one place. Minimizes cost blindspots.
- Get immediate actionable cost insights and prevent overspending – out-of-the-box ones like Cost per Customer and Cost per Feature and custom ones, such as Cost per Customer per Feature.
- Receive timely and noise-free cost anomaly alerts in time to prevent cost overruns.
- Get detailed mapping to understand the root cause of a cost spike just in time to prevent further bleeding
CloudZero offers more, including budgeting and forecasting, category-leading Kubernetes cost analysis, and real-time cost allocation (100% of your spend!). CloudZero recently helped Upstart save $20 million in cloud costs. Don’t just take our word for it.  and experience CloudZero in action now.


FinOps In The AI Era: A Critical Recalibration
What 475 executives told us about AI and cloud efficiency.