AWS tags are a bit like flossing your teeth every day — or getting eight hours of sleep a night.
Everyone agrees they’re good habits that will make life easier down the road. But sometimes life gets in the way, and those habits fall a little short.
Most teams set out with the intention to tag their infrastructure, but in our experience, it’s rare that companies have a perfect, thorough AWS tagging strategy.
As engineering teams scale over time — maybe they change leaders or pivot their product strategy — it becomes hard to maintain complete consistency. Add in a variable like technology that you’re building on because of a corporate acquisition — and it can get really confusing fast.
Even teams who do an exceptional job with their tagging still find themselves stuck when it comes to shared and untaggable resources, which leaves them slicing up data in spreadsheets.
This is why, when we designed CloudZero, we decided from the outset that we wouldn’t make perfect tags a barrier to transform your cloud cost data into intelligence.
We knew that cloud cost tools that relied on tagging had existed for about a decade — and from what we heard, AWS tags were often the reason why companies were failing to get the visibility they need.
Today, we help companies of all sizes on AWS get the cloud cost intelligence they need, aligned to the business metrics they care about — all without perfect tags. For example, we helped Remitly quickly increase costs allocated from 60% to 90%. Here’s how.
A Flexible Strategy To Cost Context
There usually isn’t a single lens through which companies want to understand their spend. Different stakeholders want answers to different questions.
For example, engineering leaders might want to know how much cost each dev team is driving and how it’s changing over time. Finance might want to know how billing will change as you onboard 50 new customers next quarter.
Asking dev teams to tag everytime you want to see your cost by a new dimension detracts from their ability to stay focused on building new features.
With that in mind, we designed CloudZero so you can view your cost across all different kinds of dimensions — without making your dev teams stop to tag.
Here are just a few of the ways you can see your cost with CloudZero:
- Cost per feature and product
- Cost per Kubernetes cluster, pod, and namespace
- Cost per individual customer or cost per tenant
- Average cost per customer
- Cost driven by each dev team
Or, maybe you want to understand how different business initiatives are impacting your cost:
- Cost of the application you’re rearchitecting into microservices.
- The impact of modernizing apps into cloud-native architecture during your cloud migration.
- Cost of the new technology you’ve acquired — and how it’s changing as you build it into your platform.
- Cost of your product launch — or that utilization spike after a big marketing promotion or onboarding a big new customer.
CloudZero’s Data Goes Way Beyond the CUR
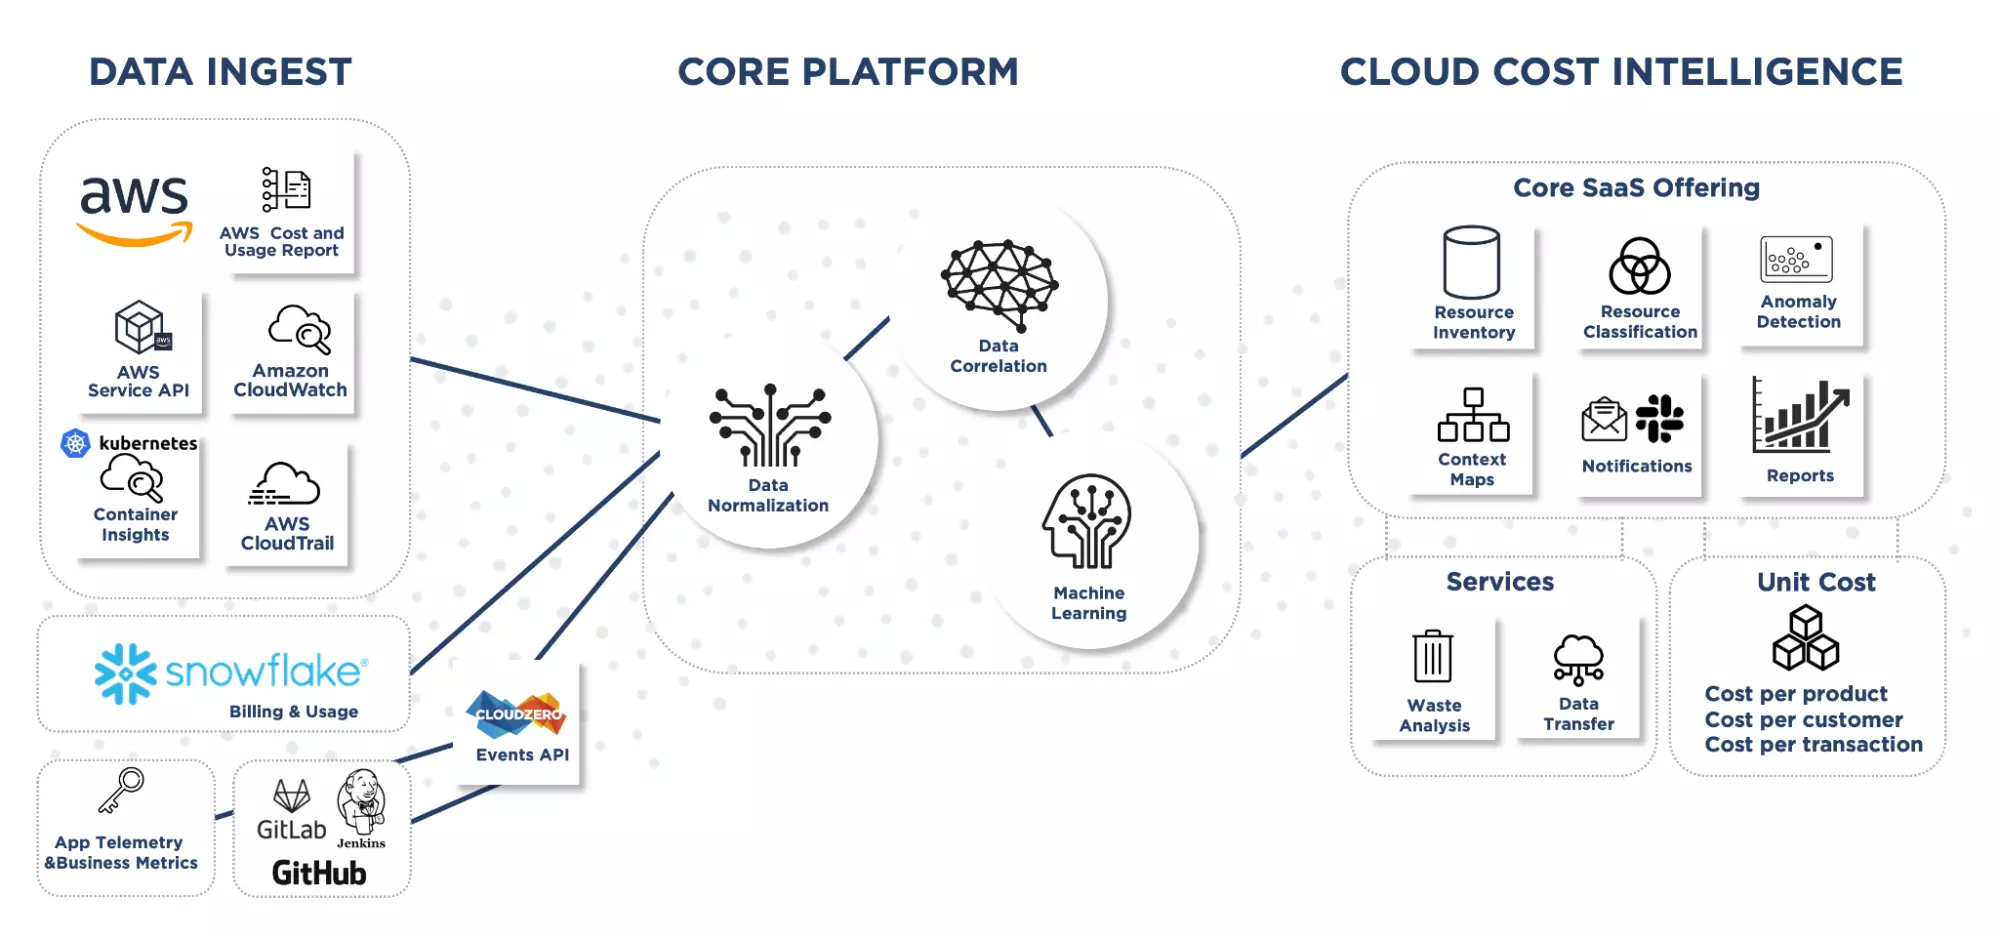
Our ability to slice and dice your cost data by all of these different dimensions, starts with how our data ingestion works. Unlike other cost tools, we’re looking at way more than just your cost and usage report (CUR).
Instead, we’re built more like an observability tool, which ingests enormous amounts of data about your infrastructure, normalizes that data, then correlates your cost with your infrastructure.
I’ve gone into this in past blogs (like this one), so I won’t get into the nitty-gritty here, but you can see the different kinds of data we ingest in this diagram.
Putting Cost in Context: How It Works
This enriched cost data serves as the base for our ability to organize cost without perfect tags.
When you first get connected to the CloudZero platform, one of our cost intelligence advisors will walk you through the process to get started — but it’s something you can eventually adjust and manage on your own if you’d prefer.
We call each dimension a “cost context.” Most of our customers choose to organize into products and features to start — and the process takes about an hour.
You most likely define your infrastructure with code — in Terraform or CloudFormation templates. CloudZero Cost Contexts are defined in a code artifact as well — in a YAML file called a context definition, using a proprietary domain-specific language. The context definition describes the logic used to group related costs together in the way that they represent your business.
The logic can be based on any number of things — and whatever tags you do have can often be a useful starting point (although we’ve also worked with companies who hardly have any tags to work off of).
We can also look at other service metadata, information extracted from your cost and usage report or even the names of Kubernetes namespaces, individual label values, or anything else that groups cost in a logical way. We can also transform your tags and metadata — correcting typos, capitalization, and other mistakes — or rename them on the fly.
To be clear, this won’t actually change any of your tags at the source (our platform has read-only permissions), but it will transform how you can view your cost in our platform.
Once you’ve set up your cost contexts, you can easily sort, filter, and view costs across all the different dimensions you care about — and drill down to explore and understand what you’re spending and why.
Most importantly, you can get that information to the teams responsible for it, to help them understand the impact of their code and deployments. You’ll get automated cost anomaly alerting and updates in Slack — and can configure it so only the appropriate teams are alerted on certain contexts.
For example, at CloudZero, we often see that our “data ingest” feature spikes a bit when we onboard a customer with especially large amounts of billing data.
We send those alerts to the appropriate engineering team that works on that aspect of our platform. Usually it’s normal and expected, but occasionally it’s higher than we anticipated and we want to make sure we know about it.
Once you’ve set up your contexts, resources will be continuously grouped by the logic you set, so you don’t need to worry about unallocated cost everytime you spin up something new and don’t tag it.
Layering on Utilization Data
Once cost contexts are set up, many of our customers choose to take it a step further in order to understand how customer utilization is impacting cost. By doing this, you can measure your cost per customer, cost per tenant, and more.
We recently published a blog about that here if you’d like to learn more.
