Profitability in SaaS can be tricky. A company’s net earnings are based on its invested capital, assets, and equity. But its profit margin shows how much money it extracts from its total sales or revenue — its ability to turn revenue into profit.
Performing a thorough margin analysis or profit margin analysis is a reliable way to assess the company’s financial health.
This guide explains what margin analysis is, how a profit margin analysis works for SaaS companies, and what tool to use to improve your profitability.
Table Of Contents
What Is Margin Analysis For SaaS Companies?
A profit margin analysis measures what percentage of sales comes from net income. Margin analysis helps companies determine their ability to generate income relative to their revenue.
Margin refers to earnings expressed as a percentage of sales, making them ideal for comparisons. Because net earnings are expressed as absolute numbers, it is difficult to compare them with the profitability of similar-sized companies.
Keep in mind that a profit margin is revenue a company earns over and beyond its cost of goods sold (COGS). You can read more about COGS and what to include when calculating your SaaS COGS here.
How To Conduct A Profit Margin Analysis For SaaS Companies
Start by calculating your SaaS company’s profit margin. Taking your gross income minus your expenses will give you your net income. Now divide the net income by your sales revenue. Multiply that outcome by 100% to get the percentage profit margin.
There are three types of profit margin analysis to know here:
- Gross margin analysis (gross profit margin analysis)
- Operating margin analysis (operating profit margin analysis)
- Net margin analysis (net profit margin analysis)
Let’s take a quick look at each.
1. Gross margin analysis (gross profit margin analysis)
A SaaS Gross Margin analysis measures the difference between the cost of goods sold (COGS) and revenue. Revenue is the amount of money you earn by selling software or software subscriptions. A company’s gross margin measures its profit on its COGS.
Gross margin is also expressed as a ratio, the gross margin ratio. A company’s gross profit is expressed in absolute terms (a dollar amount), whereas the gross margin (or gross margin ratio) is expressed in percentage terms.
The formula for calculating gross profit margin is:
Gross profit margin = Net sales revenue – SaaS COGS / Net sales revenue
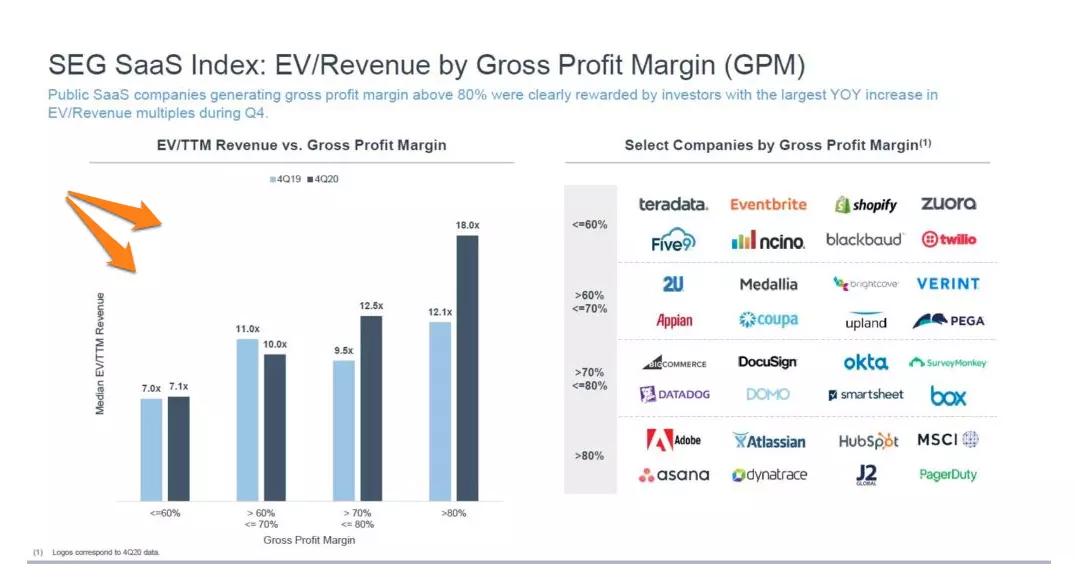
An analysis of a company’s gross margin can help estimate how efficiently it manages its costs of sales. Various companies in various sectors achieve different gross margins, but an ideal gross margin for SaaS is 70% or higher:
Credit: Software Equity
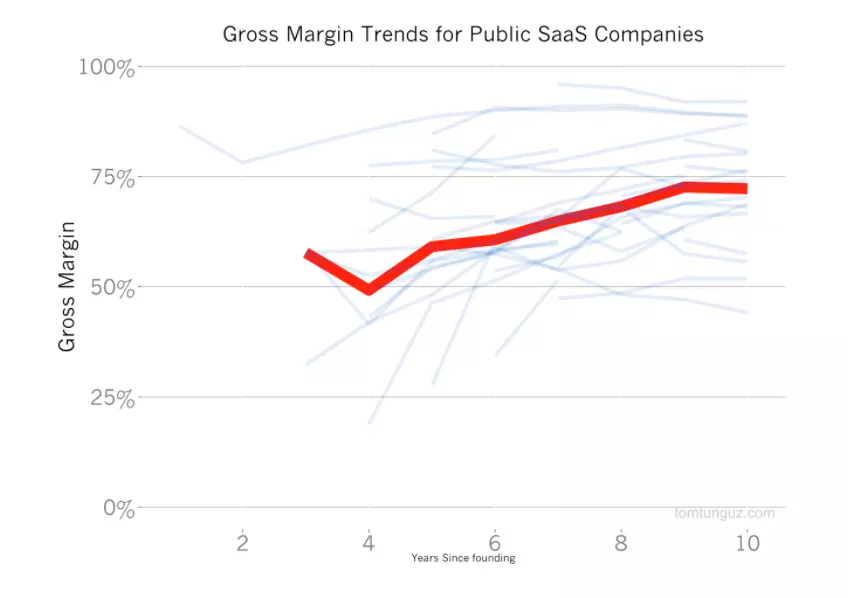
Yet, some public SaaS companies started their operations with gross profits below 50% and increased them to 70%-80%, as you can see here:
Credit: Baremetrics
2. Operating margin analysis (Operating profit margin analysis)
An operating margin compares earnings before interest and taxes (EBIT) with sales or total revenue. The calculation includes all operational expenses and the COGS.
Operating expenses include Amazon Web Services fees, third-party software fees, salaries, wages, and administrative costs.
Calculate operating margin using the following formula:
Operating profit margin = EBIT / Sales or Total Revenue
An operating margin analysis helps determine to what extent a company can support its operations — for example, whether it has any money left over after all expenses to foster growth.
3. Net margin analysis (net profit margin analysis)
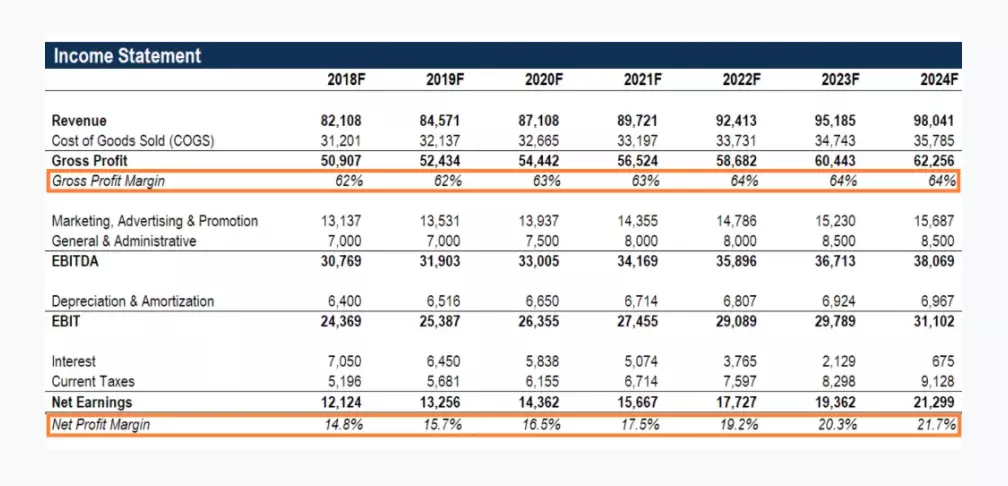
A net margin analysis calculates profit after deducting all expenses, including interest, non-operating expenses, and taxes. Net profit is often presented at the bottom of an income statement, which explains why it is also called “the bottom line“.
Credit: Corporate Finance Institute
Calculate net profit margin using the following formula:
Net profit margin = Net profit after taxes, interest, and non-operating expenses / Sales or revenue
If a company earns $250,000 after taxes on $2 million in sales, its net profit margin is 250,000/2,000,000 = 0.125 X 100% = 12.5%.
Margin analysis goes beyond calculating gross margin, operating margin, and net margin.
As soon as you have those three margins, it is time to research your industry peers’ financial performance. Comparing your numbers to similar companies will help you understand and benchmark what you find.
But, what is the point of calculating SaaS margins? How does conducting such an analysis benefit companies such as yours?
Why Calculate Margin Analysis For SaaS Organizations?
SaaS profitability ratios are a good measure of a company’s financial health. A margin analysis offers the following benefits:
- It will give you insights into the ability of your SaaS company to convert sales into net profit, which is the amount of cash left over for future growth or to return to investors.
- An analysis of gross margins is extremely useful for understanding SaaS valuation. You must understand your margin and improve it to attract sufficient funds and stock prices.
- The operating margin measures how efficiently a company uses resources compared to how much you make from them. A low operating margin may indicate high operating costs before taxes and loan interest. You can then analyze the costs at a granular level and see where you could cut costs without compromising operations.
- With this information, you can determine whether you’re hitting an ideal profit margin for your industry, so you can adjust your SaaS pricing to improve profitability.
- Performing all three margin analyses will help you pinpoint precisely where you need to improve.
- An analysis of margins over time is a reliable method for tracking profit margin changes. It can be month-over-month, year-over-year, or over more extended periods, like three to five years, to determine profitability growth.
Perhaps you are struggling to maintain healthy margins. Are there cost drivers that could be at fault, and what can you do to correct them?
What Type Of Costs Reduce Margins For SaaS Companies?
For SaaS companies, cost of goods sold, also known as the cost of sales, is the biggest threat to healthy margins.
SaaS costs include software licenses and subscription fees that directly support the development and operation of your software-enabled service. Transaction fees, salaries, and wages for the team directly supporting the revenue-earning service also count.
Yet many SaaS companies don’t have an issue with software licensing fees — at least not nearly as much as they do with Amazon EC2 instances, Amazon S3 storage, and other cloud computing costs. An AWS cloud bill is one of the most complex billing statements a cloud-based company receives.
AWS historical bills do not break down how companies used cloud resources in previous billing cycles. Companies are often unsure what they are paying for.
It is difficult for them to assess:
- Which tenants’ workloads drive their costs.
- Which customer segments are the least profitable so the SaaS company can review pricing for those specific customers at renewal to improve margins on the customer’s cost of goods sold.
- What features hog the most resources, when, and why
- When a company uses the most resources. The company can then marshal resources to provide smooth experiences during peak times and turn off some resources to save money during off-peak times.
- Why their cloud costs are rising, including which cost centers are driving that increase, such as a particular development team or deployment project
As long as cloud costs aren’t understood at that level, it’s nearly impossible to identify cloud waste and find ways to reduce costs.
Tracking SaaS costs also requires continuous monitoring, which is difficult to accomplish manually. Additionally, it is not enough to use traditional cloud costs management tools because they only provide a zoomed-out view of costs.
CloudZero’s Cloud Cost Intelligence Can Help
Instead, you need an AWS unit cost analysis method to help you uncover your AWS costs without endless tagging or taking weeks to discover cost anomalies.
While most SaaS cost tools are designed for finance professionals only, we designed CloudZero to help both engineering and finance teams organize and understand their cloud spend.
The shift-left approach aligns engineering and finance teams, enabling them to zoom in and out of their COGS’ finer details.
Since CloudZero’s cloud cost intelligence aligns costs to specific business outcomes, engineers can track costs per product, feature, development project, or team.
When renewal time approaches, finance can determine which customers are most expensive to support so that you can come up with a more profitable pricing strategy. C-Suite can also see its COGS and gross margins, enabling them to see how they stand with competitors.
CloudZero even monitors and alerts designated team members on Slack about rising costs to prevent overspending.
 to see why CloudZero is the profit margin analysis solution you’ve been missing.
