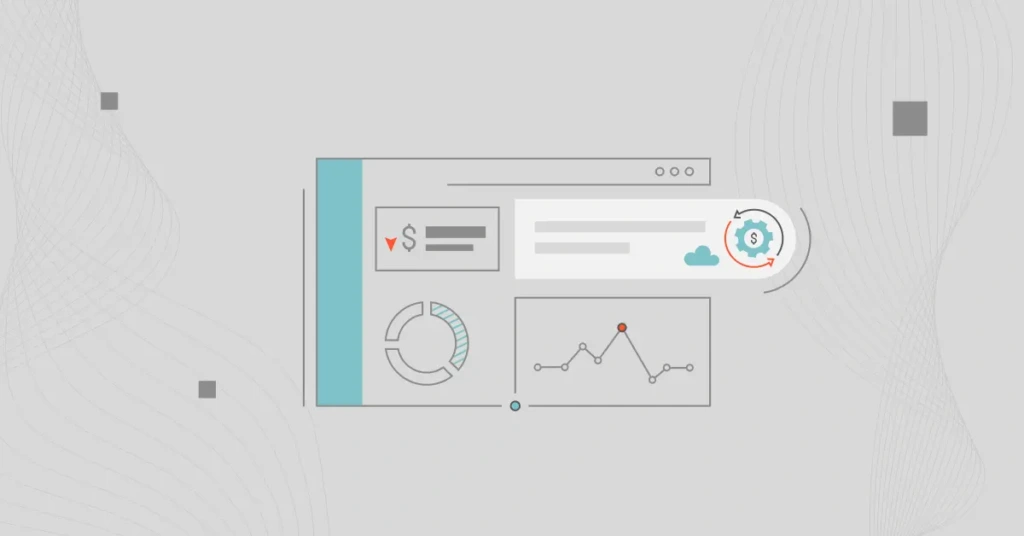
FinOps dashboards help manage cloud financial operations by providing real-time visibility into cloud spending, resource utilization, and cost optimization.
They are part of the broader FinOps framework, which combines finance and DevOps practices to improve collaboration between technology, finance, and business teams. This collaboration supports financial accountability and optimizes cloud costs.
In addition, the dashboards can help you pinpoint areas for improvement by visualizing and tracking various FinOps metrics and KPIs.
The Indispensable Role Of FinOps Dashboards And Monitoring In FinOps
A FinOps dashboard is like the cockpit of an airplane for SaaS companies. Imagine piloting a jet without instruments — no altimeter, speedometer, or fuel gauge. You’d be flying blind, hoping the engine doesn’t sputter and you don’t accidentally head into a storm.
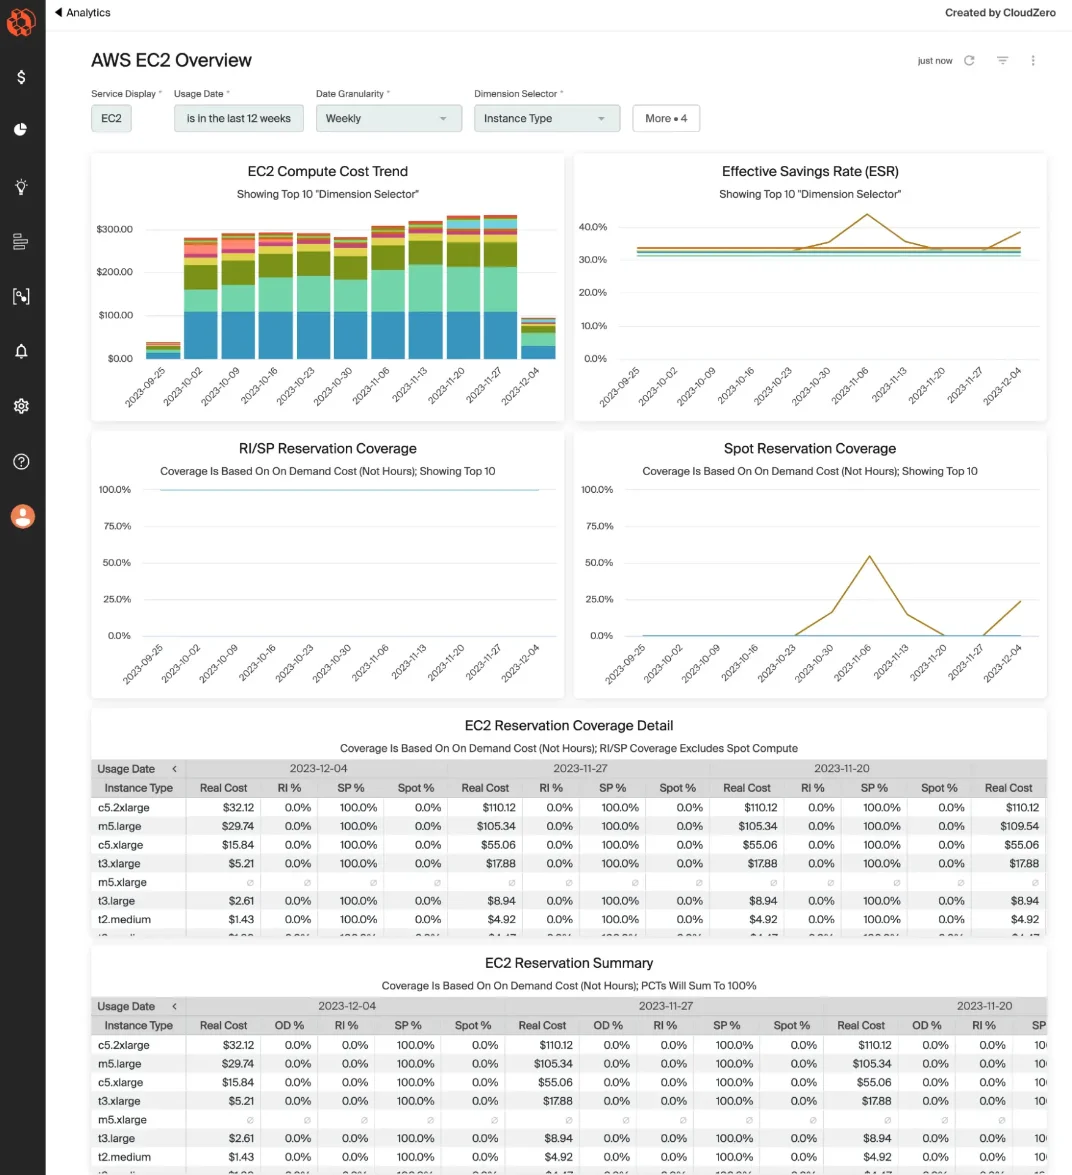
Example FinOps dashboard – CloudZero’s AWS EC2 Usage overview
Similarly, without FinOps dashboards, a SaaS company can’t monitor its financial health, cloud usage, or operational efficiency.
These dashboards provide real-time data about costs, usage patterns, and performance — essentially, your “flight instruments” for navigating cloud cost optimization.
You can also use a robust FinOps dashboard to:
- Centralize FinOps monitoring. Consolidate data from various sources, track performance, and identify areas needing improvement — all in one place.
- Get real-time insights. Get near real-time updates on financial metrics to support proactive decision-making on the go.
- Simplify data visualization. Use visual elements like charts and graphs to spot trends and cost anomalies in your cloud usage.
- Track FinOps performance. Support continuous monitoring of key performance indicators (KPIs) — handy for assessing your FinOps strategies and making data-driven adjustments.
- Customize and collaborate better. Tailor your dashboards to display specific FinOps metrics most relevant to your organization’s objectives.
To continue our analogy, the dashboards can help prevent financial turbulence by helping your teams identify waste (like running idle instances or over-provisioning resources), set cost controls (your financial autopilot), and ensure everyone from engineers to CFOs is aligned on the same flight plan.
Without one, you’d be flying at the mercy of unexpected cost overruns, which can be catastrophic in the competitive SaaS skies.
Yet, even the best FinOps dashboard won’t be helpful if it doesn’t display the right KPIs and metrics for cloud financial management.
Crucial FinOps Metrics To Track Immediately
Here are examples of FinOps metrics for SaaS companies that you’ll certainly want to track (and why).
Cost per Customer
The average cost per customer and total cost metrics equating all customer costs. But cost per customer lets you see exactly how much you spend on each customer. Like this:
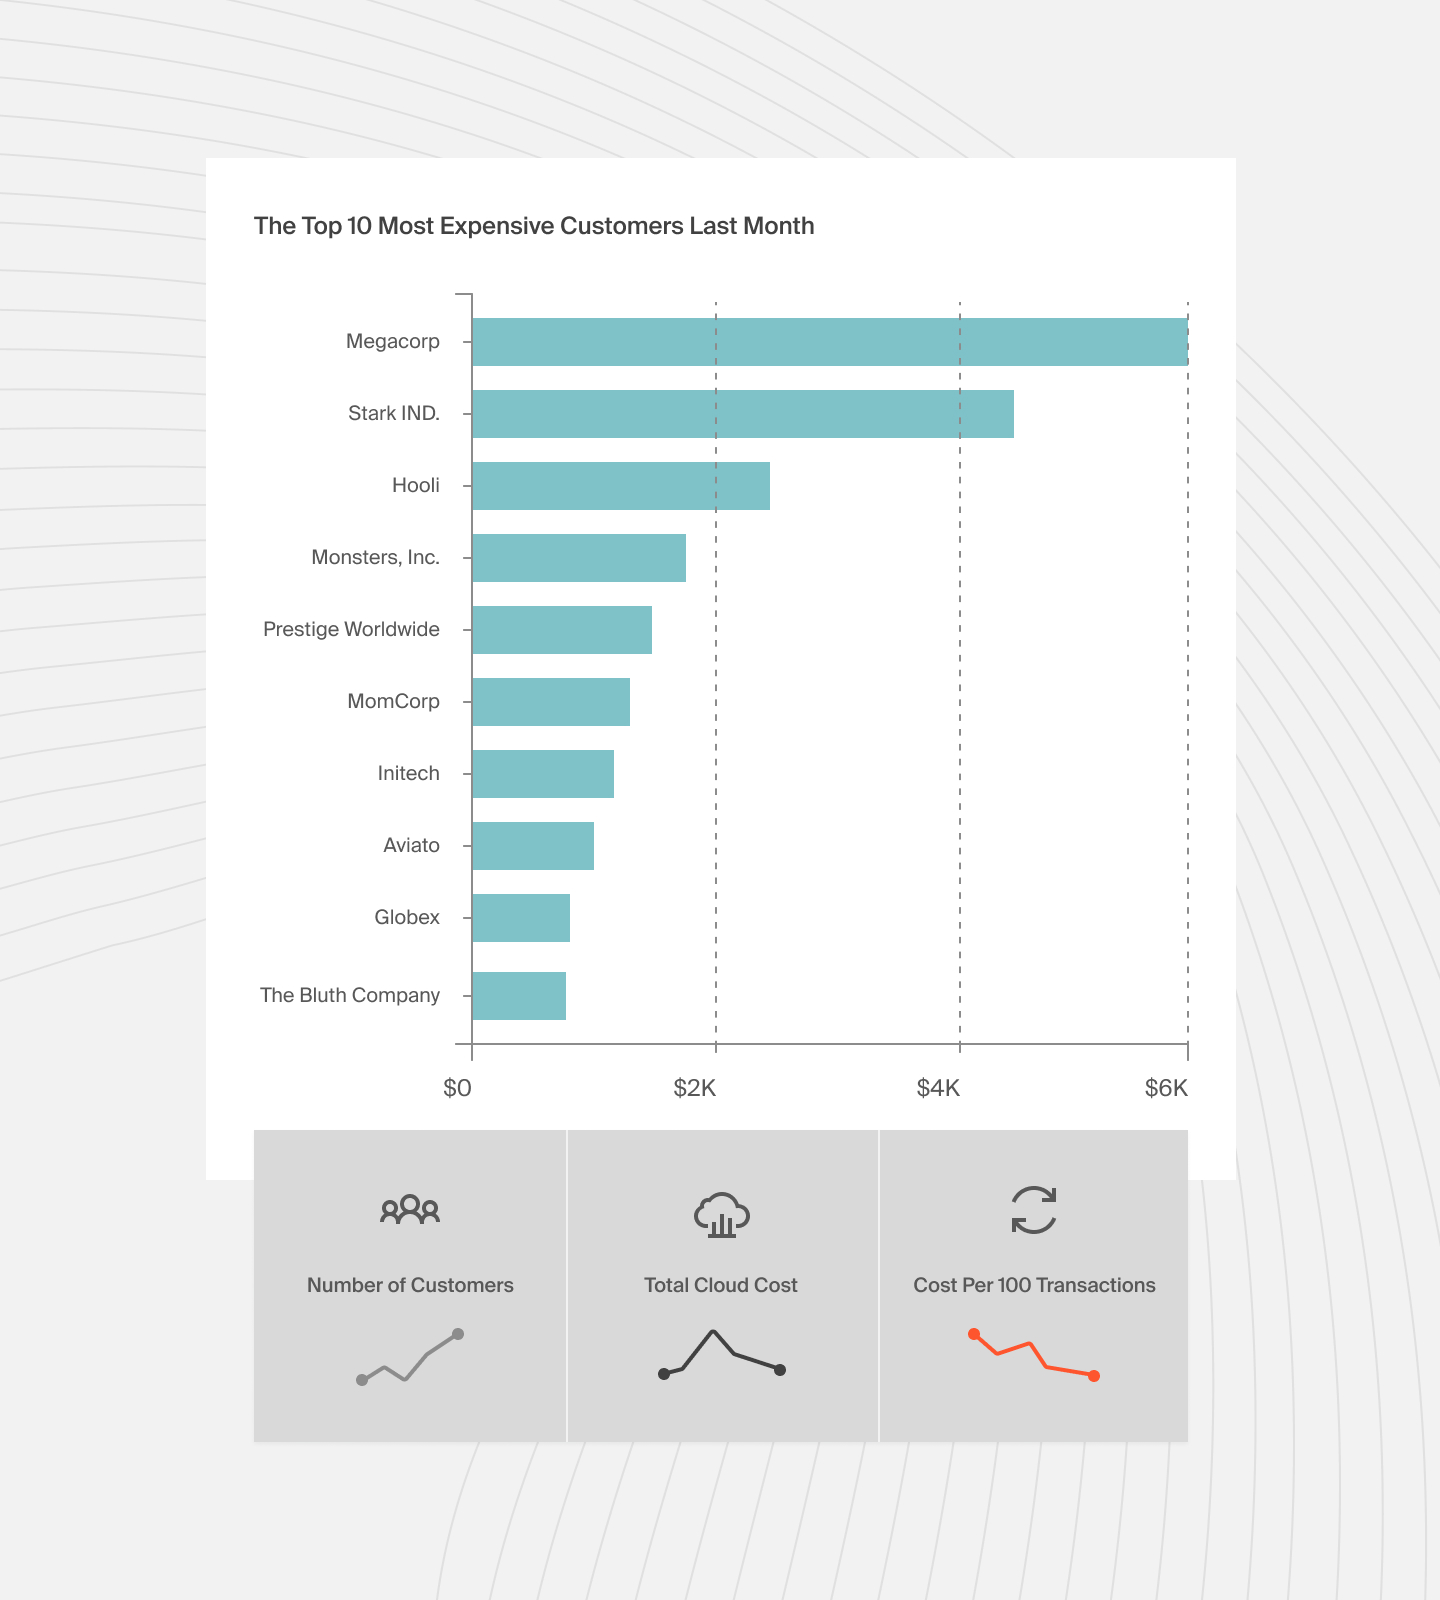
It’s a more effective method for several reasons:
- Understand cost distribution: Identify the percentage of your total costs from specific customers, helping you strategically allocate resources.
- Set fair pricing: Base pricing on each customer’s actual usage, ensuring it’s fair while protecting your margins. Plus, it can help you determine the level of discount you can offer to encourage renewals without compromising your profitability.
- Track cost trends: Over time, you can understand how onboarding new customers could affect your overall costs, which is handy for planning.
- Spot high-value customers: Pinpoint your most profitable customers or segments so you can focus your marketing efforts on them to further boost your margins.
Want to measure yours but aren’t sure where to start? See how CloudZero measures cost per customer here. Better yet, Check out how these four companies measure their cost per customer and improve their bottom line.
Cost per Feature
While cost per customer is invaluable for finance and FinOps teams, cost per feature is an excellent way to help engineers see how their technical decisions and design choices impact your organization’s bottom line.
This level of insight is crucial for protecting your profit margins as your business grows. You can use the metric to make informed decisions, such as:
- Revisiting free vs. paid plans: Move an expensive feature from a free plan to a paid one to ensure its sustainability.
- Evaluating feature popularity: Assess how widely a feature is used. If it’s unpopular, you might retire it to reduce costs or improve it with new functionality to drive adoption.
At the same time, you can track your cost per customer per feature to analyze how much each customer uses specific features or services (and the associated costs). For example, if a feature costs $10,000 per day and a customer uses 1% of it, their cost contribution is calculated based on that usage.
Cloud Efficiency Rate (CER)
The Cloud Efficiency Rate (CER) measures the relationship between a SaaS company’s revenue and cloud spending, expressed as a percentage. Check this out:
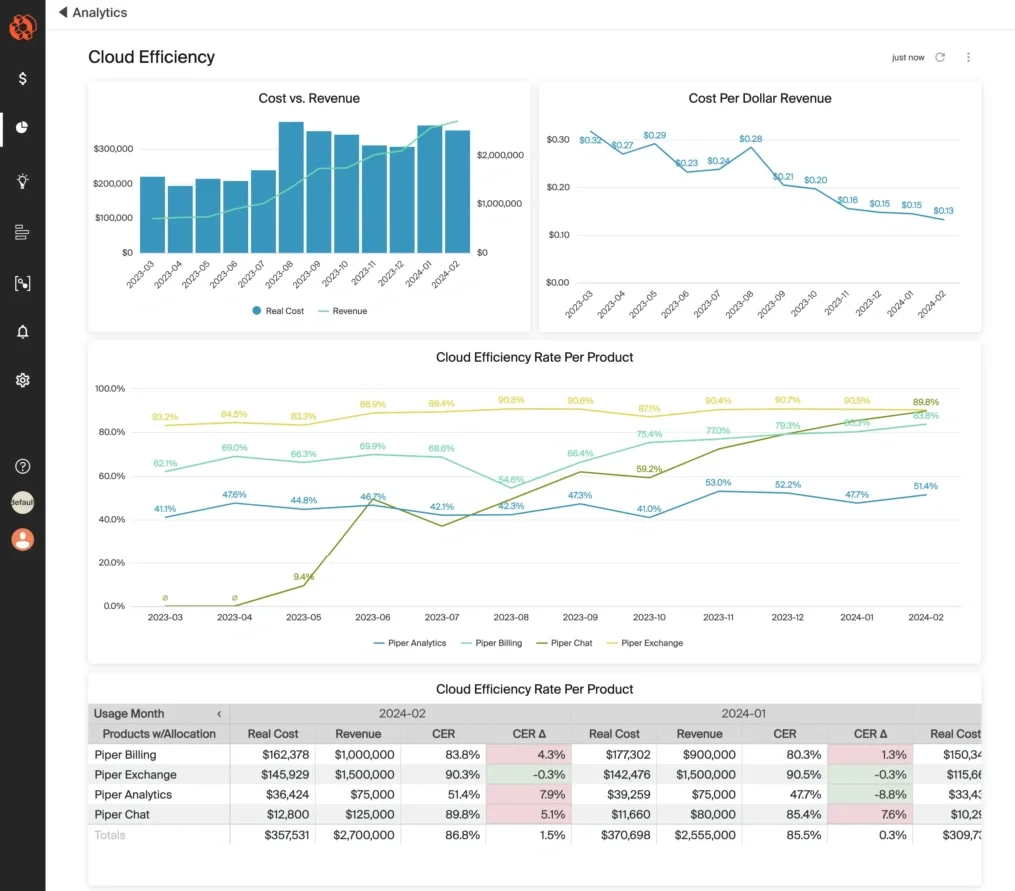
Example Cloud Efficiency Rate dashboard for FinOps teams
The metric indicates how much of every dollar earned is retained after accounting for cloud costs. This means tracking it can help your FinOps team assess profitability, identify inefficiencies, and optimize cloud investments for better financial performance.
Cost per Daily Active User
Cost per Daily Active User is a unit cost metric that quantifies the costs involved in servicing each active user daily. It is a crucial metric for SaaS companies wanting to assess cloud efficiency, make informed pricing decisions, and ultimately improve profitability by aligning costs with user demand and usage patterns.
Untagged spend
Untagged costs can distort your spending patterns, making it hard to generate accurate cost reports. The challenge is that achieving perfect tagging is tough for most teams, as there will always be a mix of tagged, untagged, and untaggable resources.
Without proper visibility, this can lead to surprise cloud costs, complicate budgeting, and hinder strategic decision-making, ultimately affecting profitability and growth potential.
On top of that, untagged costs can create compliance risks, putting your company’s financial stability at further risk.
Forecasted month-end costs
This FinOps insight involves predicting future cloud costs using historical data and growth trends. It can also help your team evaluate whether they’re staying within budget or overspending.
Additionally, it can help identify any areas of waste, inefficient spending, and potential cost savings and optimization opportunities. They can then adjust usage as needed to keep costs in check.
Reservation coverage
Reservation coverage tracks the percentage of resource usage hours covered by reserved instances (RIs). Major cloud providers like AWS, Azure, and GCP offer these cost-saving options, along with alternatives like Spot Instances and Savings Plans.
To calculate it, divide the hours used by RIs by the total usage hours.
Here’s an example:
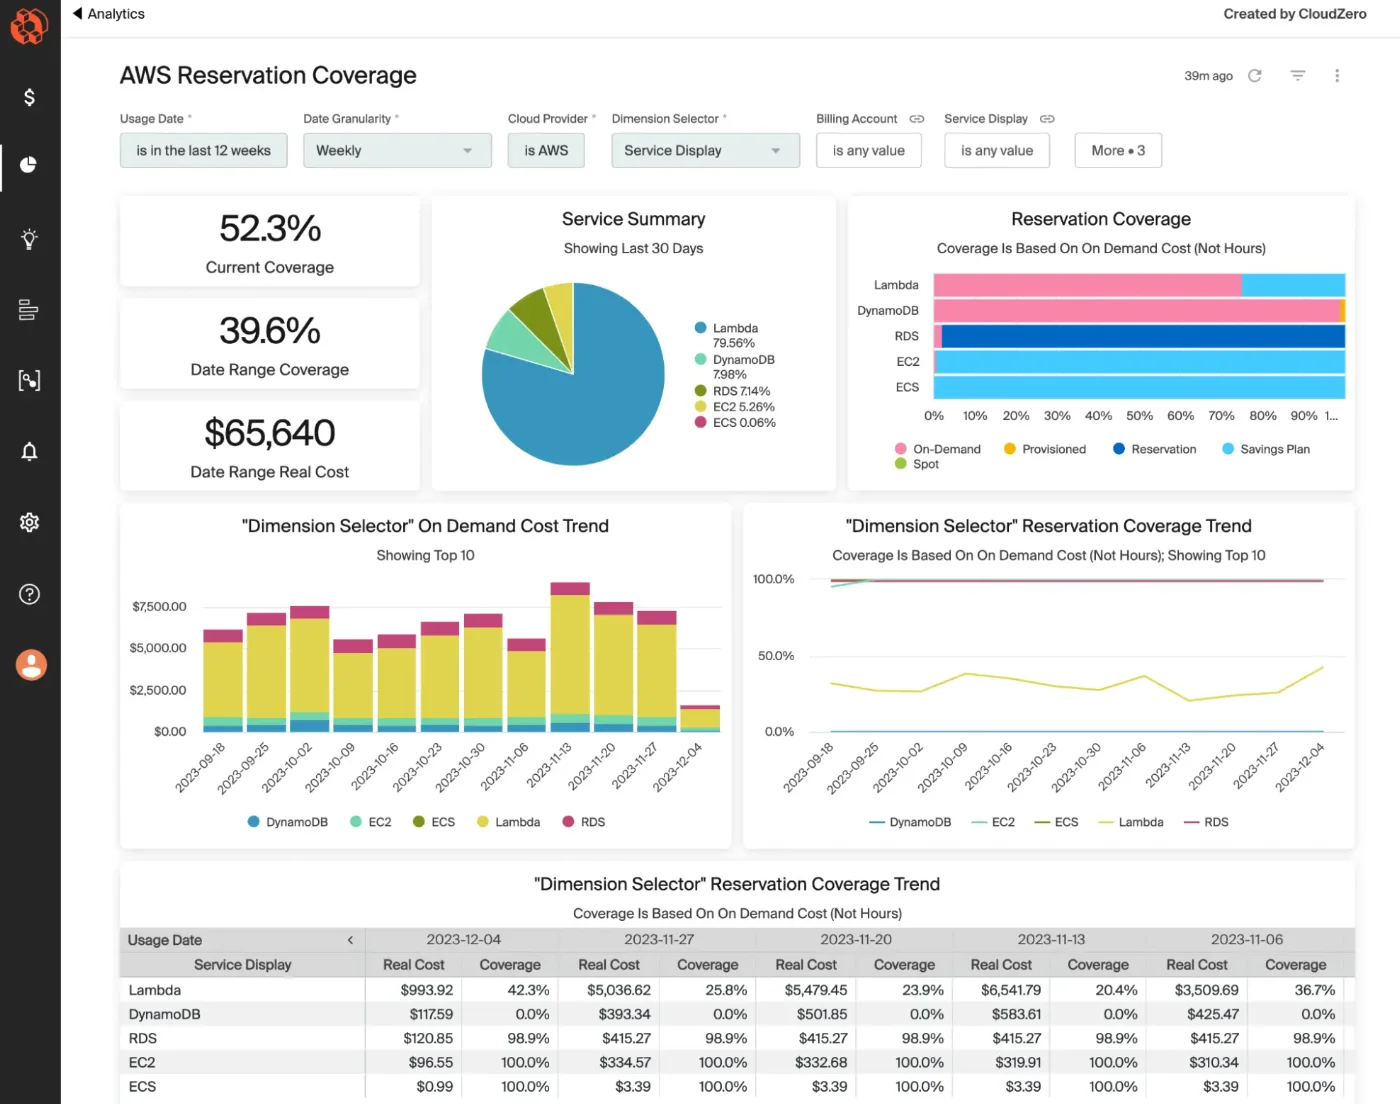
Example Reservation coverage dashboard
The metric can help SaaS companies improve financial predictability and maximize savings from reserved capacity.
FinOps score
You can use this for your FinOps maturity assessment. A FinOps score indicates a company’s ability to use FinOps tools for cost monitoring and optimization. It reflects adherence to best practices like resource optimization and budget management throughout the FinOps maturity journey.
The key components that influence the FinOps score include:
- Cloud resource utilization: Measures how effectively cloud resources are used, indicating efficiency and potential waste.
- Cost allocation: The ability to assign costs accurately to specific teams or projects.
- Percentage of cloud waste: Identifies unused resources that incur costs, highlighting areas for optimization.
- Forecasting accuracy: Assesses how closely predicted spending aligns with actual costs, which affects budgeting and financial planning.
- Automation and tools utilization: The extent to which automated tools are employed for monitoring and optimizing cloud spend.
This example dashboard from the Google Cloud Platform’s FinOps Hub highlights these components.
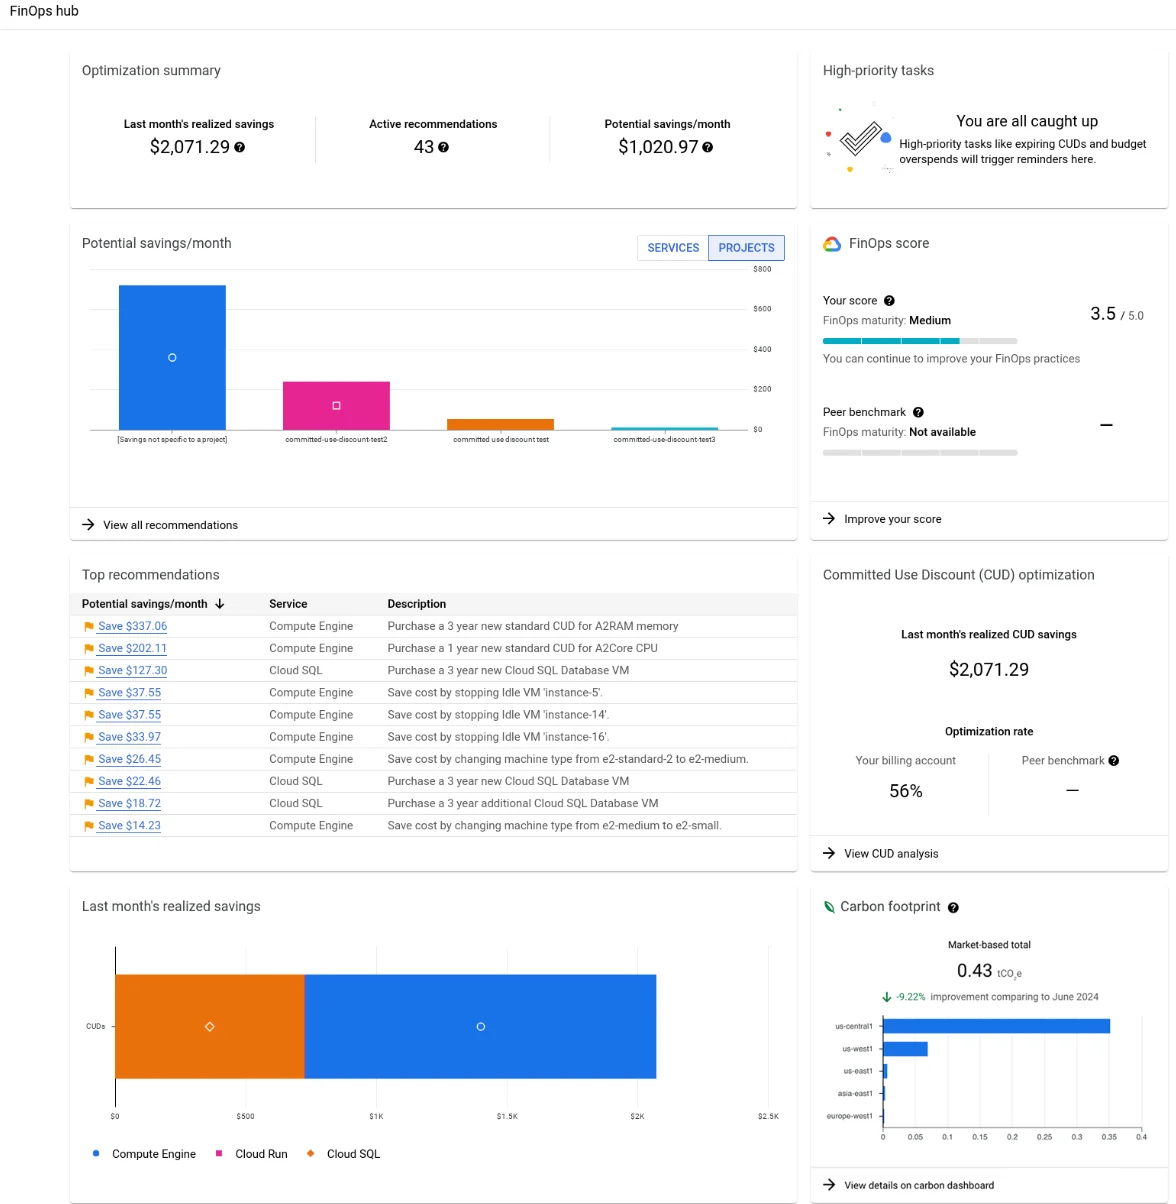
FinOps score dashboard by GCP
What To Look For In A FinOps Dashboard: Features And Views
A reliable FinOps dashboard will feature the following key cloud financial management must-haves at the very least:
- Unit cost metrics. As we discussed earlier, average cost isn’t the same as cost per customer. That’s why your FinOps dashboard should provide precise, per-unit insights whenever you need them.
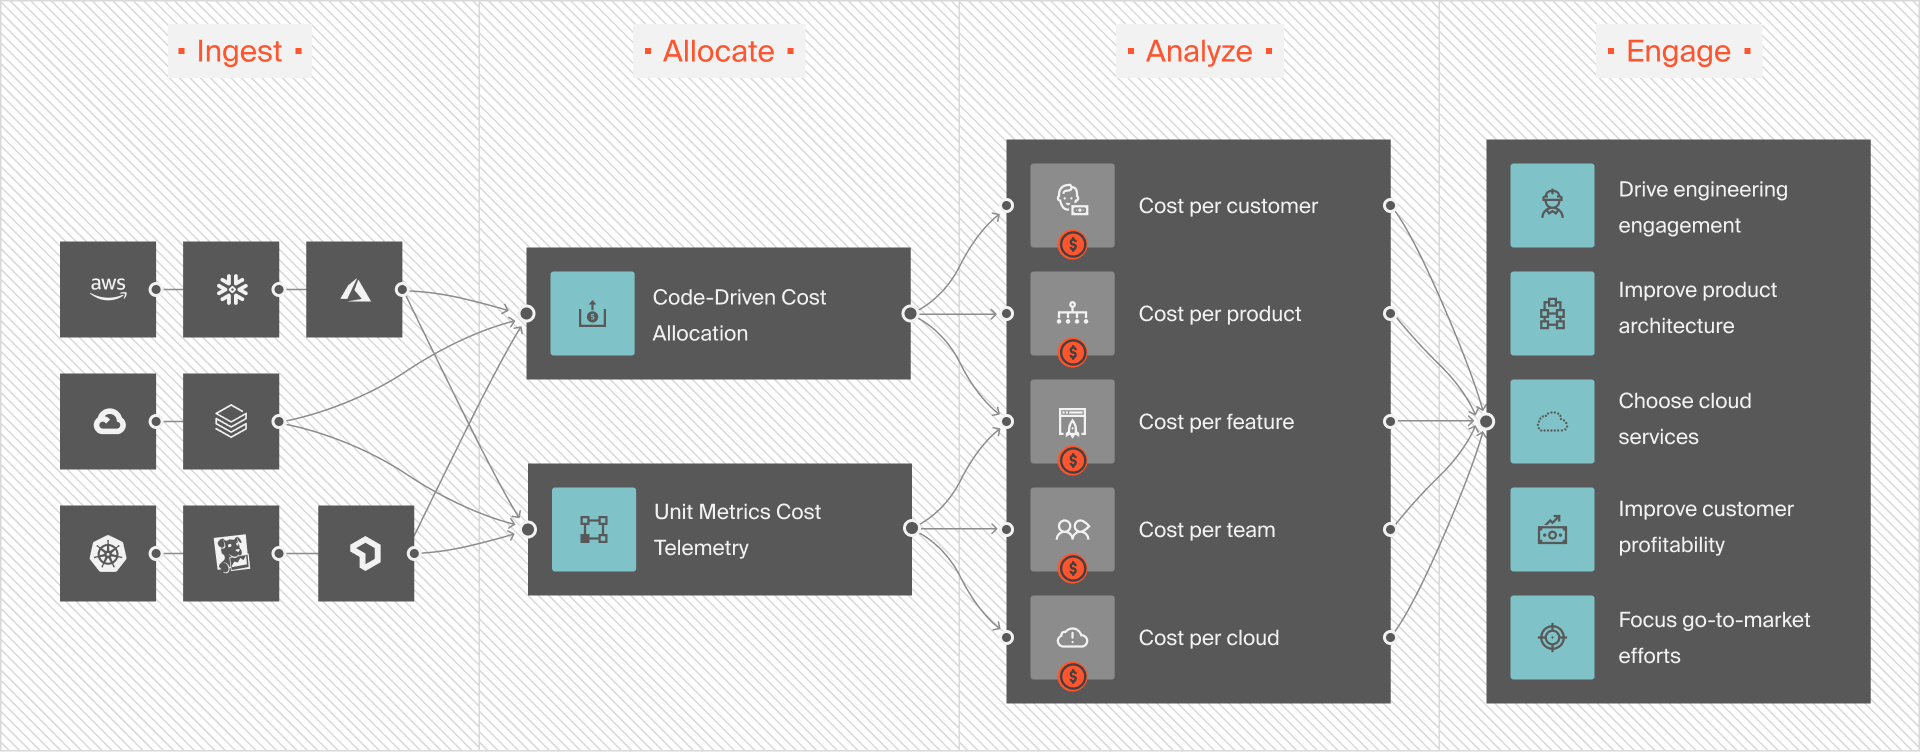
Example unit cost metrics by CloudZero
- Centralized FinOps monitoring. Getting insights shouldn’t be a matter of hopping from dashboard to dashboard. A single dashboard should consolidate data from various sources for easy tracking.
- Real-time insights. It must offer real-time or near-real-time updates on financial metrics so you can make timely decisions and prevent cost overruns.
- Data visualization. You’ll want elements like charts and graphs to present complex data clearly. This can help your team quickly identify trends, patterns, and anomalies in cloud spending.
- Performance tracking. It should allow comparisons against historical data and other credible benchmarks to evaluate your FinOps strategies.
- Customizability and drill-down capabilities. Your people should be able to customize the dashboard to display metrics relevant to their specific objectives. Drill-down features enable deeper analysis of specific cost drivers or areas needing improvement.
- Forecasting and budgeting tools. Forecasting tools help predict future costs based on historical trends, while budgeting tools govern spending to align it with your financial goals.
- Collaboration features. Your team should be able to view, edit, and share cost reports easily among themselves and with the C-Suite. The dashboard should create a shared visual framework that aligns everyone on cost optimization initiatives.
- Alerts and notifications. You need these to be timely, noise-free, and contextual, enabling you to identify and address the root causes of cost spikes and other issues before they tank your budget.
- Integration with other tools. Compatibility with existing cloud management tools, cloud vendors, data platforms, and data export capabilities ensures seamless integration into your broader financial reporting framework.
Conventional cost tools don’t consolidate these essential FinOps insights in one place — but CloudZero does.
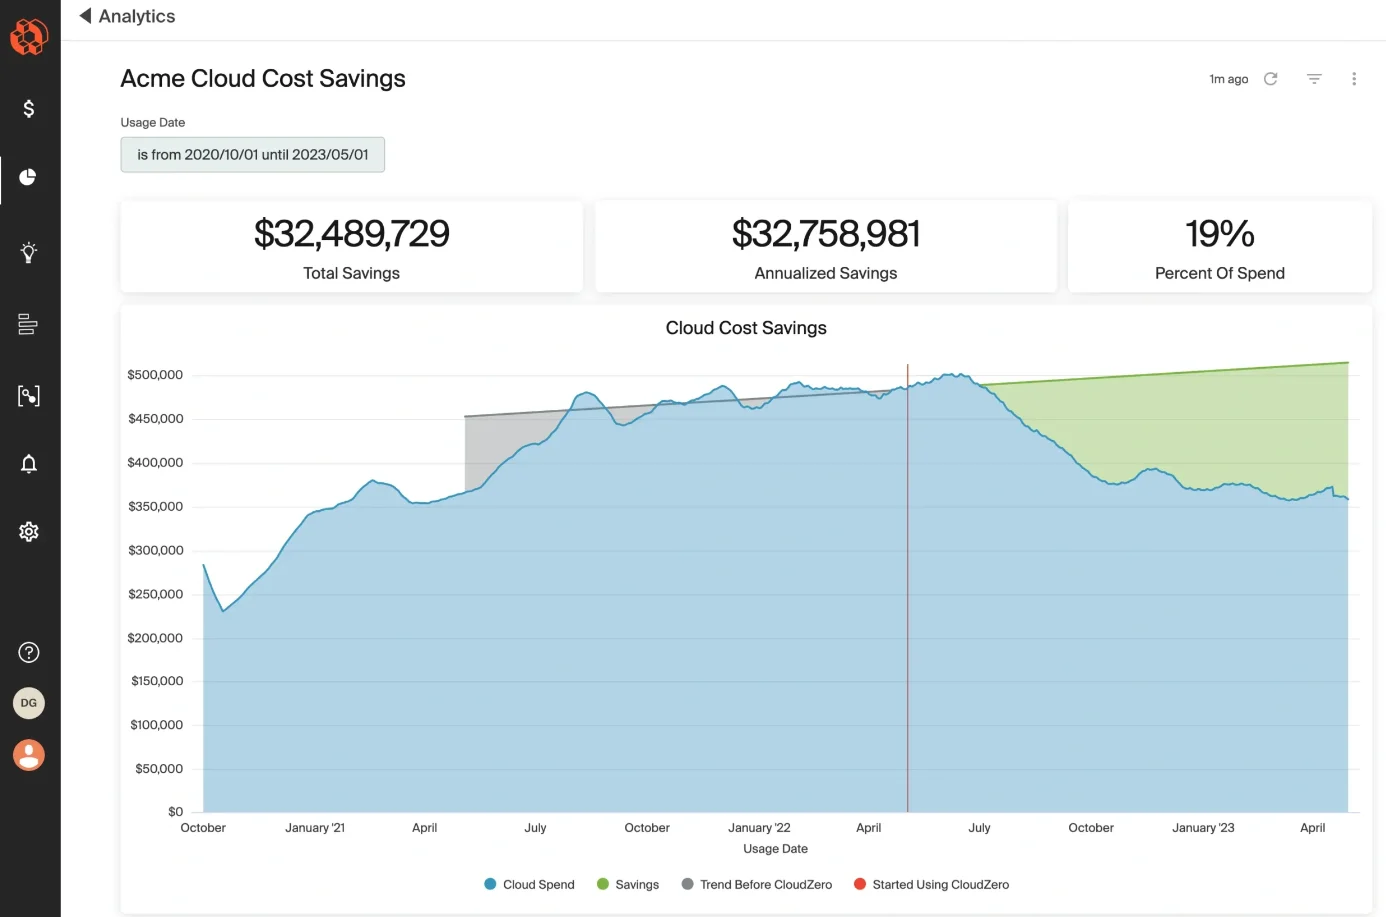
With CloudZero, you can:
- Allocate 100% of your cloud costs to eliminate cost blind spots.
- Unify cost data across multiple clouds (AWS, Azure, GCP) and platforms (Snowflake, Kubernetes, New Relic), regardless of tagging quality.
- Track all resource costs — tagged, untagged, untaggable, and shared — with precision.
- Leverage real-time anomaly detection to identify and address cost spikes before they lead to pricey surprises.
- Access personalized support from your very own Certified FinOps Practitioner.
These benefits are why innovative brands like Shutterstock, SeatGeek, and Remitly trust CloudZero to manage over $5 billion in cloud spend for them. Others, like Drift and Upstart, recently saved over $3 million and $20 million using CloudZero.
Ready for results like these — or better? Trying CloudZero is risk-free.  and see CloudZero in action — on us!
