
Software engineers use engineering performance metrics to make informed decisions about their products, features, processes, and even their dev teams. In addition, measuring lets you know if you’re on track to meet your engineering goals.
With so many tasks, data, and other information to monitor, how do you choose the right metrics to track? We’ll share that and more in this guide.
Engineering Metrics Vs. Engineering KPIs: What’s The Difference In Software Engineering?
DevOps engineers, IT professionals, and management use the terms interchangeably. Yet, metrics and KPIs do not mean the same thing.
All KPIs are metrics. But not all metrics are “key” performance indicators in software engineering.
What are engineering metrics?
Engineering metrics show the status of various engineering aspects. They include progress or performance data. Today, you can measure plenty of software engineering metrics. The main engineering metric categories include:
- Product metrics: These metrics measure various attributes of a product, such as its size, features, design, quality, and reliability.
- Process metrics: These metrics analyze the procedures, tools, methods, and deployment cycles of software engineering.
- Project metrics: These metrics describe the characteristics of a software development project, such as cost per customer, time, people, and the number of customers involved.
Most modern software development tools offer rich dashboards that display a variety of metrics. The different metrics do not contribute equally to improving software quality or engineering workflows. Metrics that correlate with specific organizational objectives are the ones to measure. This is where KPIs come in.
What is an engineering KPI?
An engineering KPI (Key Performance Indicator) is a quantifiable metric that an engineering team uses to gauge its success over time — and whether or not they’re meeting set strategic goals. Engineering KPIs can be performance-, security-, or cost-related.
The following are four examples of engineering goals you may be working on:
- Build more reliable software by reducing the number of bugs reported.
- Increase deployment cycles by reducing churn.
- Reduce code length to minimize software complexity and errors per line of code.
- Rearchitect a specific feature for increased profitability.
Each of these goals will require a metric or set of metrics to measure your progress toward achieving it. What KPIs should you measure for each goal? How do you measure the right engineering KPIs for each purpose?
playbook
The AI Cost Optimization Playbook
Traditional cloud cost management is broken. Here’s why — and how to make the switch to cloud cost intelligence.
How To Measure The Right Engineering Metrics And KPIs (Engineering Metric Selection Framework)
A lot of engineers feel metrics are unfair. “Software development cannot be quantified”, they might say. However, often they really mean using metrics like “business value”, “story points”, “tickets”, and “lines of code” to judge software engineers’ productivity, which is neither accurate nor fair.
The following seven characteristics will help you find the right metrics to track and measure.
- You should be able to express metrics in numerical terms.
- They should be simple to define, calculate, and understand.
- A metric must apply to various phases of the software development process.
- Metrics need to be repeatable so that you can measure them consistently.
- Engineering metrics should be cost-effective to calculate.
- Metrics should not be written in a programming language.
- Metrics should also be comparable for benchmarking.
So, are the benefits of measuring, tracking, and tweaking your engineering metrics worth all the effort?
Consider the following.
What Are The Benefits Of Tracking Engineering Metrics?
Engineering metrics deliver both qualitative and quantitative benefits, including the following.
- Promote data-driven engineering decision-making: Data-driven engineers don’t rely on intuition alone. Instead, they use data to determine how to improve their product, promoting customer satisfaction and a healthy bottom line.
- Monitor progress: Engineers can provide stakeholders with realistic timelines by measuring the time it takes to reach different milestones.
- Measure code quality: By monitoring specific metrics, such as bug reports and code coverage, engineers can improve their processes to meet code quality standards.
- Improve visibility into team performance: Engineering KPIs can provide insight into how well the team is meeting productivity goals.
- Measure customer satisfaction: Surveys and Net Promoter Score (NPS) are two ways to determine whether your product or service is meeting customers’ expectations.
- Nurture continuous improvement: By tracking engineering metrics, you can tell whether changes make a difference to the service or if you’re just doing busy work.
- Help promote efficiency and cost-effective solutions: Cost-conscious engineering teams develop solutions that gain market advantage and protect their organizations’ margins.
With these benefits in mind, what are the top software engineering KPIs you’ll want to track, monitor, and measure for your organization?
10 Core KPIs That Ensure Software Engineering Success (Top Engineering KPIs Explained)
Each organization sets its own KPIs based on its targets, so the following ten won’t make an exhaustive list. However, the following engineering KPIs span various types of metrics in software engineering, from people- and process-related metrics to project, internal, and external metrics. They include:
- Quality-related KPIs
- Engineering productivity KPIs for engineers
- Collaboration KPIs
- Responsiveness KPIs
Now let’s look at a few of the top KPIs for engineering teams.
1. Velocity
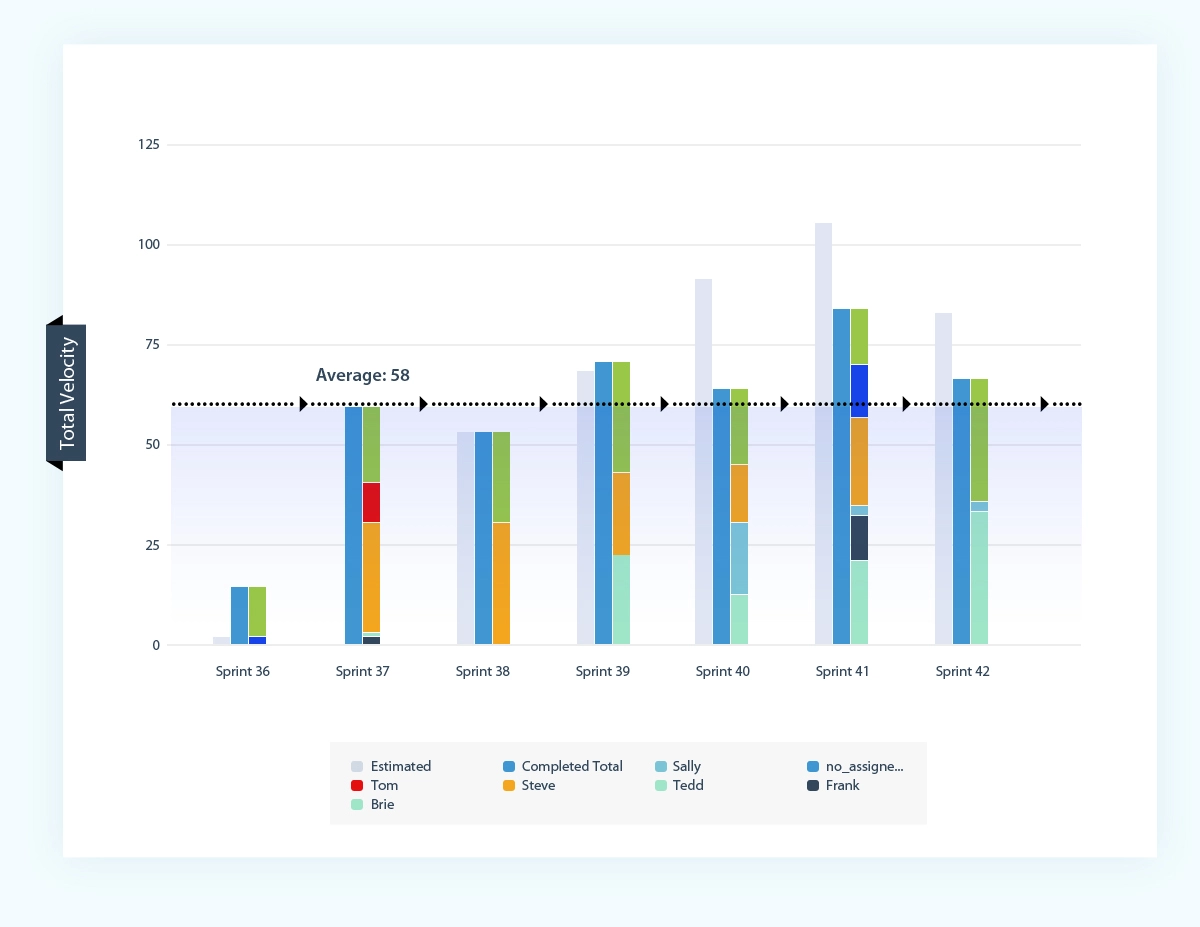
Velocity is an engineering productivity metric that shows how much work a team completes in a sprint. It helps estimate how long future work will take and whether your delivery pace is improving. Velocity is measured in story points or hours and is unique to each team. When velocity and actual output diverge, it often signals issues in throughput, commitment size, or code quality.
2. Cycle time
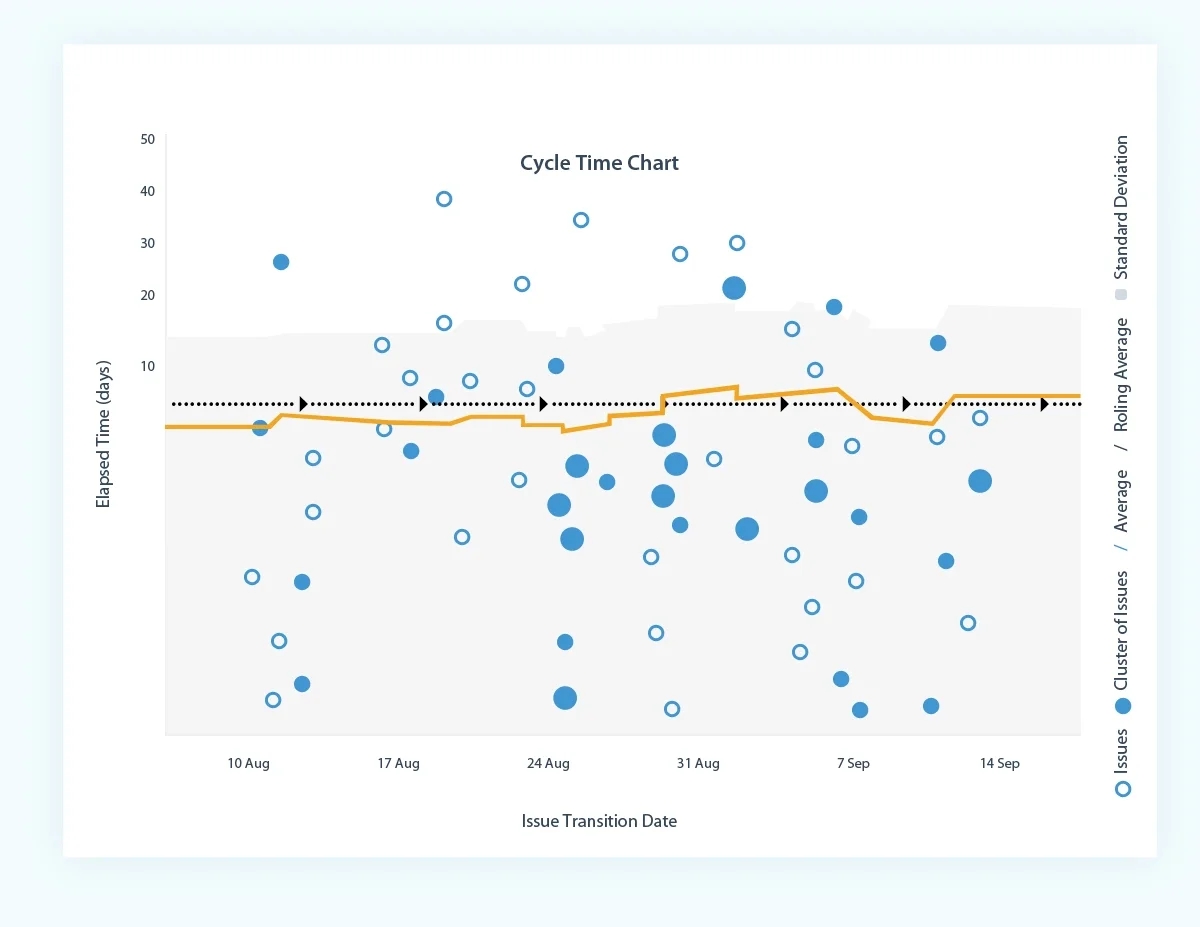
Cycle time is an engineering productivity metric that measures how long it takes to complete a piece of work from start to finish, including any rework. Shorter cycle times indicate smoother workflows and fewer bottlenecks. Teams use this metric to spot slow stages in their pipeline and to forecast delivery timelines for similar tasks.
3. Cumulative flow
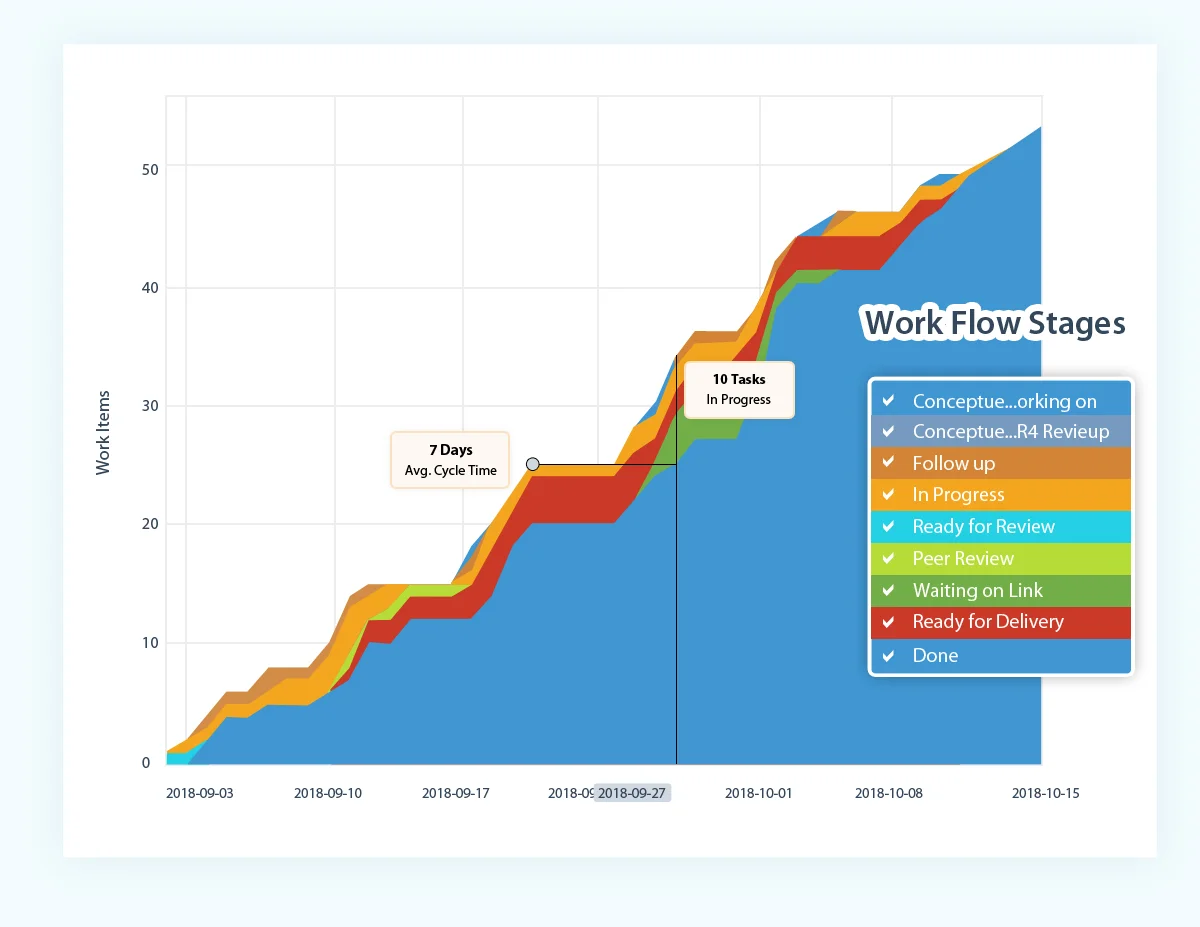
Cumulative flow diagrams show how work moves through different stages over time. Parallel, evenly spaced bands indicate healthy throughput. Widening bands show growing backlogs or bottlenecks, while narrowing bands reveal unused capacity. This metric helps teams maintain stable, predictable workflows.
4. Sprint burndown
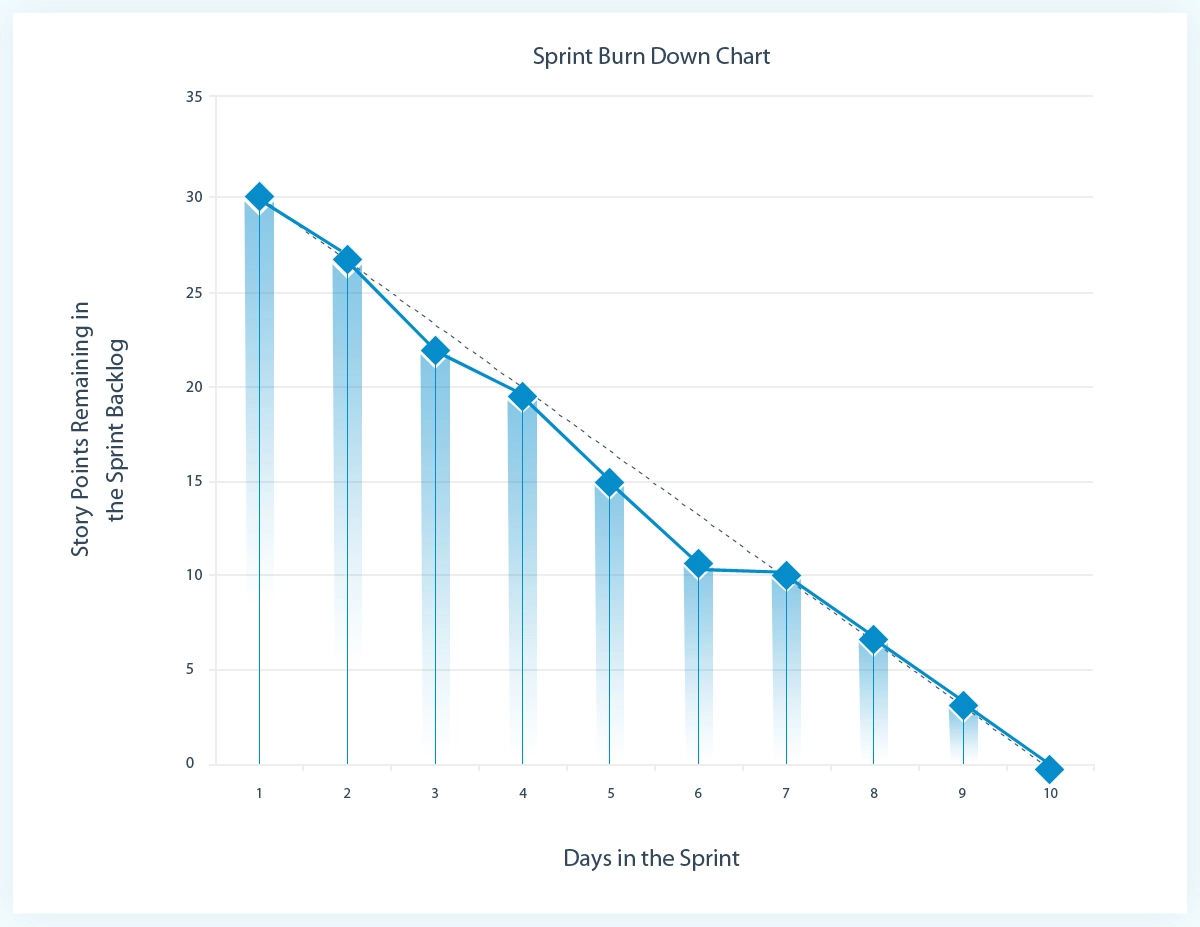
A sprint burndown chart shows how much work remains in the sprint and whether the team is on pace to finish. Burndown helps uncover unplanned work, stalled tasks, or inconsistent progress early in the sprint. It also highlights when teams need to adjust scope or unblock work.
5. Release burndown
Release burndown tracks the progress of an entire product or feature release. It shows how scope changes affect timeline expectations and whether the release is trending ahead or behind schedule. Teams use this metric to plan future sprints and adjust priorities as work evolves.
6. Code churn
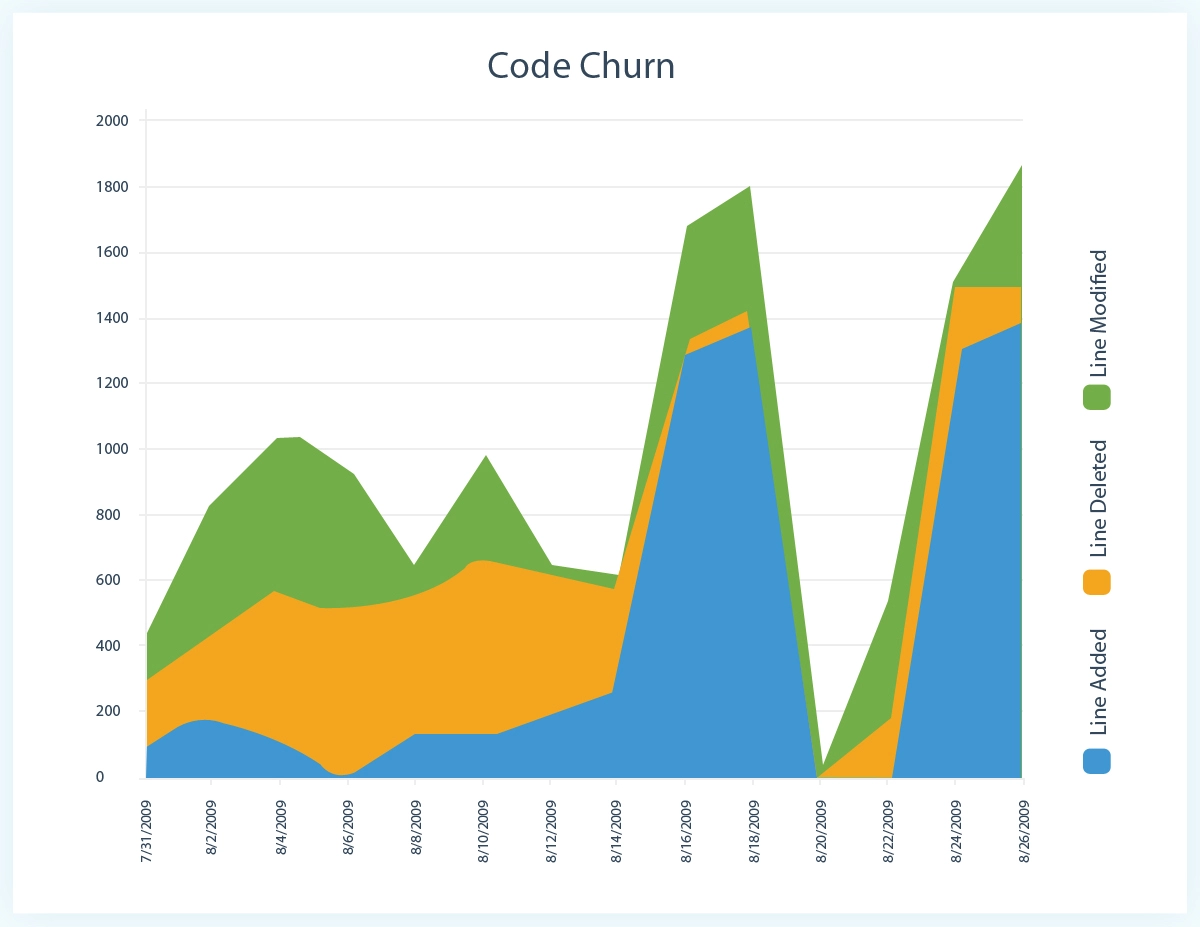
Code churn measures how often developers rewrite or delete code they recently wrote. Some churn is normal early in development, but persistently high churn near release may signal instability or unclear requirements. Tracking this metric helps maintain code quality and reduce unnecessary rework.
7. Mean time to repair (MTTR)
MTTR is an engineering productivity metric that measures how long a team takes to restore service after an incident or deploy a fix for a defect. Lower MTTR reflects strong resilience and efficient incident response processes. In security contexts, MTTR shows how quickly teams can respond to and remediate vulnerabilities.
8. Mean time between failures (MTBF)
MTBF reflects the reliability of your system by measuring how long it runs before failing. Higher MTBF indicates more stable releases and fewer customer disruptions. Teams use this metric to test software quality over time.
9. Supporting each other
Strong engineering organizations track how well team members support each other. Collaboration metrics include pull request involvement, code review response times, knowledge-sharing activity, and how often developers help unblock peers. These signals highlight team health and promote continuous improvement.
10. Cost
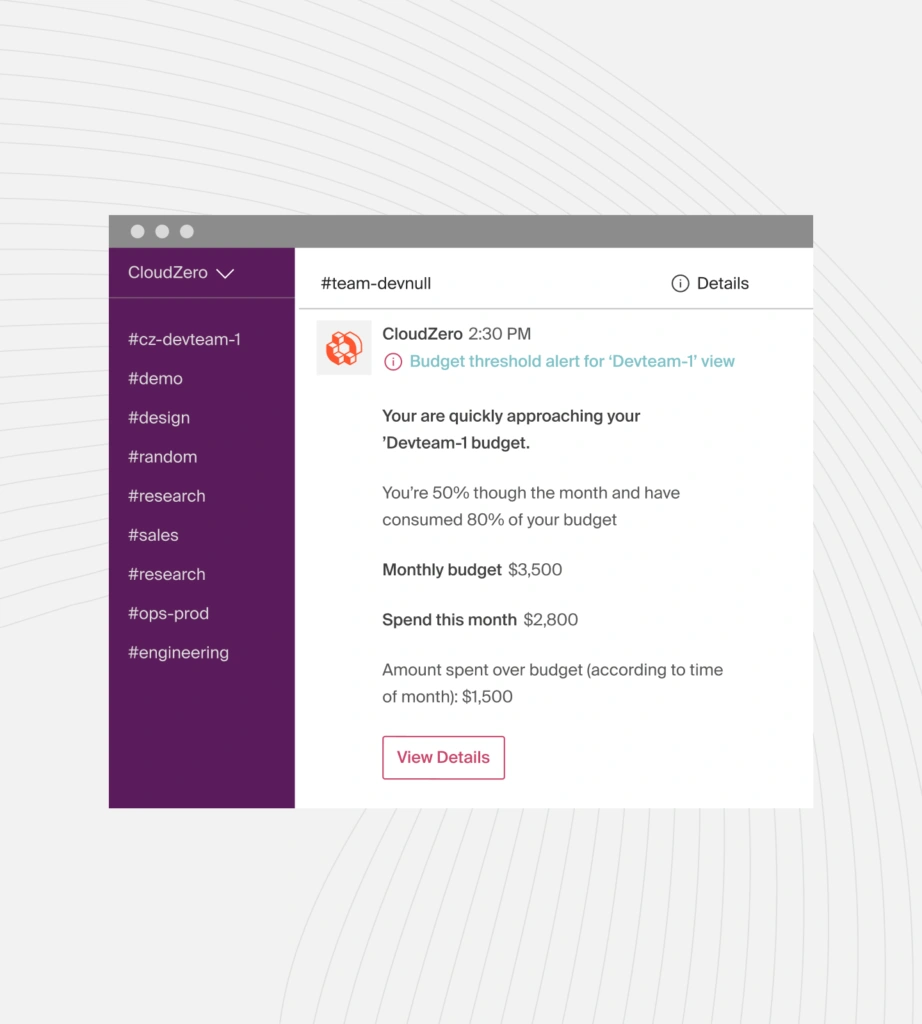
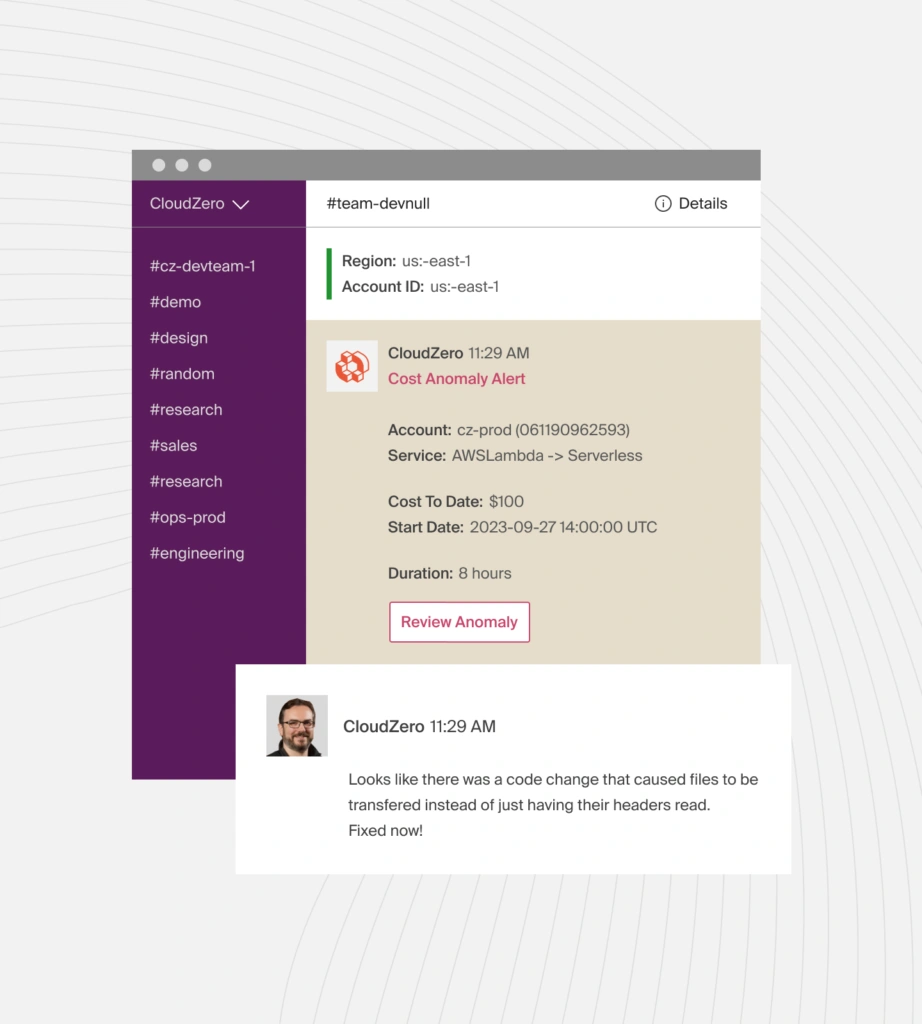
Cost metrics help teams understand the financial impact of their technical decisions. Tracking engineering cost per feature, service, or deployment helps with budgeting, prioritization, and resource planning. Most organizations use cloud cost intelligence platforms to integrate engineering activity with actual cloud usage and organizational outcomes.
Below is an example of what engineers see when CloudZero detects spend drift or budget overrun:
How To Align Engineering Metrics With Your Company-Wide Goals
Engineering metrics are only helpful when they connect to business outcomes. On their own, they show activity. Mapped to revenue, cost, and customers, they become KPIs that leaders can use to make decisions.
Linking metrics to specific features, customers, teams, and products is a good starting point. For example, tracking cost per feature alongside usage shows how much it costs to support a capability and how often customers rely on it.
If a feature is popular and expensive to run, you might move it to a higher pricing tier or bundle it into a premium plan. If it is rarely used and costly, you can refactor it, limit its availability, or retire it to reduce waste.
CloudZero can help
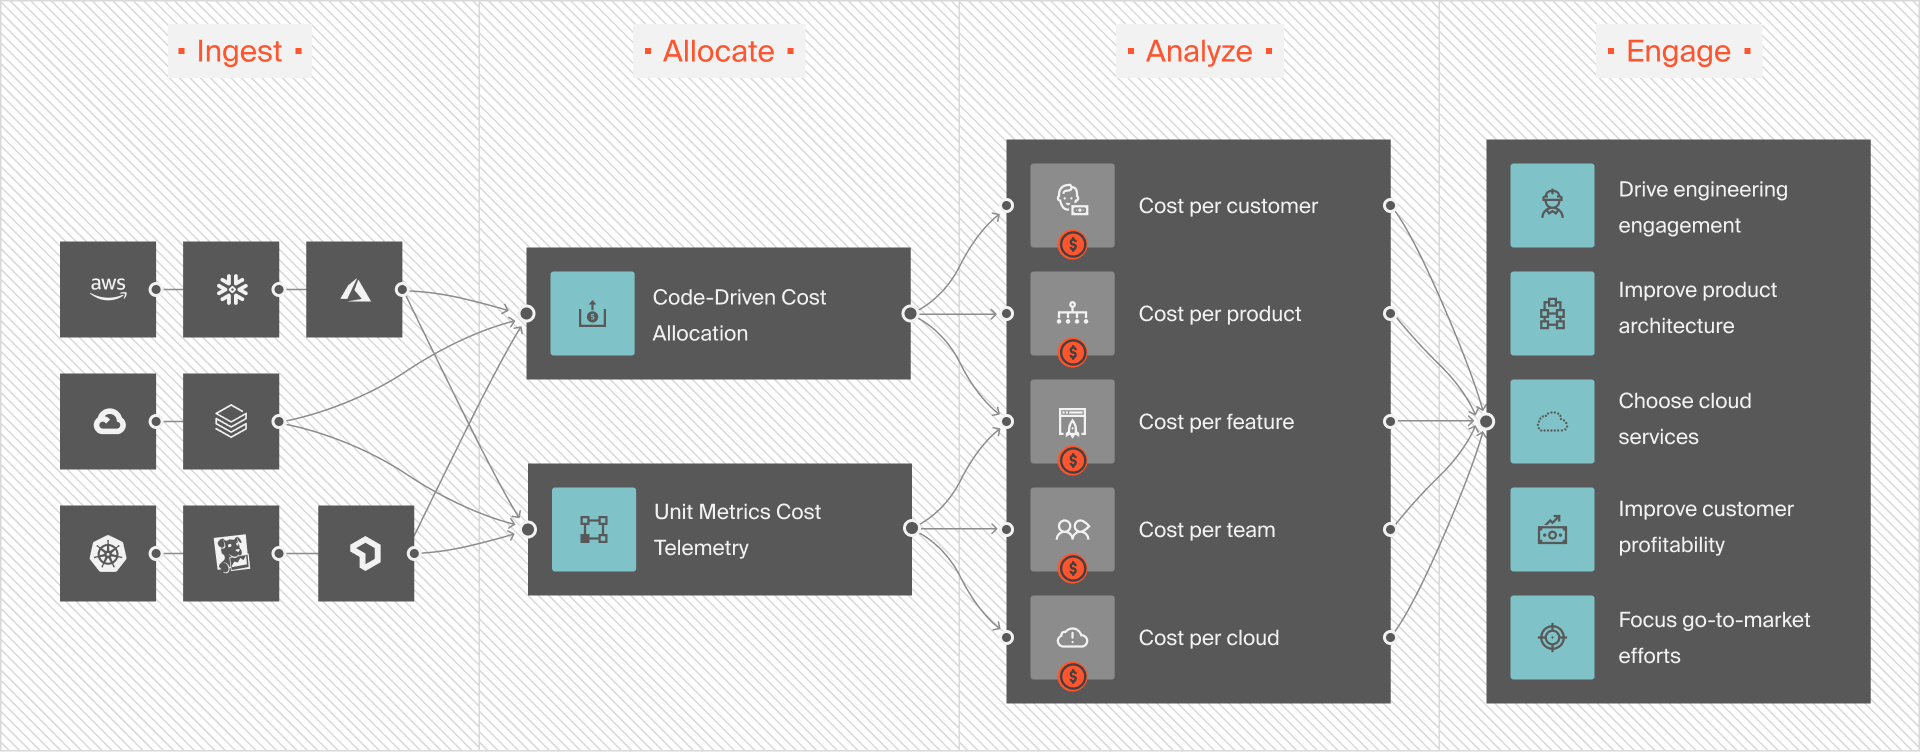
CloudZero helps you integrate engineering metrics directly to business dimensions. The platform surfaces granular views such as cost per deployment, feature, service, team, migration, and project, so you can see how technical work shows up on your cloud bill.
By shifting cloud cost intelligence left, CloudZero gives engineers near real-time visibility into how their architectural choices affect spend. Context-rich cost anomaly alerts highlight unusual changes, so teams can identify which actions or releases drove the spike.
Over time, this feedback loop teaches engineers which patterns to avoid and which designs lead to cost-effective, scalable systems. Savings can then be reinvested into new features, performance improvements, or more competitive pricing.
CloudZero is built for engineering teams and integrates with environments like AWS, Kubernetes, and Datadog. Instead of stitching together multiple tools, teams get a unified view of their cloud usage and costs.
Yet, reading about CloudZero is nothing like experiencing how it ties engineering metrics to cloud costs firsthand. Take a product tour and  to experience CloudZero in action.
Frequently Asked Questions About Software Engineering Metrics And KPIs
Here are answers to some burning engineering metrics FAQs.
How do you measure productivity in software engineering?
Each organization measures productivity differently. But the most common method is to calculate the output for a specific timeframe, such as user stories or lines of code.
What is the most useful software engineering metric to measure?
Engineering cycle time is one of the most critical metrics to track since it gives you an idea of how efficient your processes are.
What are the KPIs for engineering maintenance?
Consider mean time between failure, unscheduled downtime, maintenance costs, and work order cycle time.
What is the difference between lead time to changes and cycle time in engineering metrics?
A software engineer’s lead time to change is the time from receiving a feature request from a project stakeholder to fulfilling it.
Meanwhile, cycle time refers to the time spent developing a feature until it is ready to ship.
This metric demonstrates the velocity of a development process. It indicates how quickly engineering can deliver a product to the customer, from start to finish.


