In Part I of this two-part series, I talked about the key benefits of top-down cost allocation: It starts at the provider level, incorporates every penny of your cloud spend, and lets you break it down at as granular a level as is useful for your business. In Part II, I answer the most common follow-up question I get: “How does my organization know when we’ve got deep enough granularity?” Or, in other words: “Are we there yet?”
True cost allocation is as much of an art as it is a science. After unifying your data streams, you control the journey, deciding which metrics are important to you, developing methods for measuring them, and identifying the most impactful places to dive deeper.
The thing is, no matter how deep you’ve dived, you can always dive deeper. If cost per customer is good, cost per product per customer is better, and cost per feature per product per customer is better still.
But there are still greater levels of depth. Whatever business units are most relevant to you, you can theoretically drill any of them down to the byte level — isolate every storage byte, every network byte, every memory byte, and understand what each one costs.
You might instinctively realize that isolating every single byte is not a good use of resources. But at what point does “good use of resources” turn into “not a good use of resources”? How do you know what level of metrical depth is right for you? How can you train yourself to answer the question “Are we there yet?”
It’s Not About Maximum Depth — It’s About Maximum Business Impact
The truth is, there’s no single level of depth or magnitude of accuracy that’s universally “deep enough.” You should assess additional layers of depth based on whether or not they add business impact — not just whether they add pixels to your cost visibility resolution.
Furthermore, “business impact” is not binary. It’s a sliding scale.
Here’s what I mean. In top-down cost allocation, visibility starts with a single meaningful metric. Many CloudZero customers start with Cost Per Business Unit or Cost Per Product Feature.
These are metrics we can calculate with relative ease based on cost data from all your cloud providers, with basic tagging or code-based allocation. For the purposes of this article, we’ll call these first metrics “Level 1 Metrics.”
Do Level 1 Metrics deliver maximum business impact?
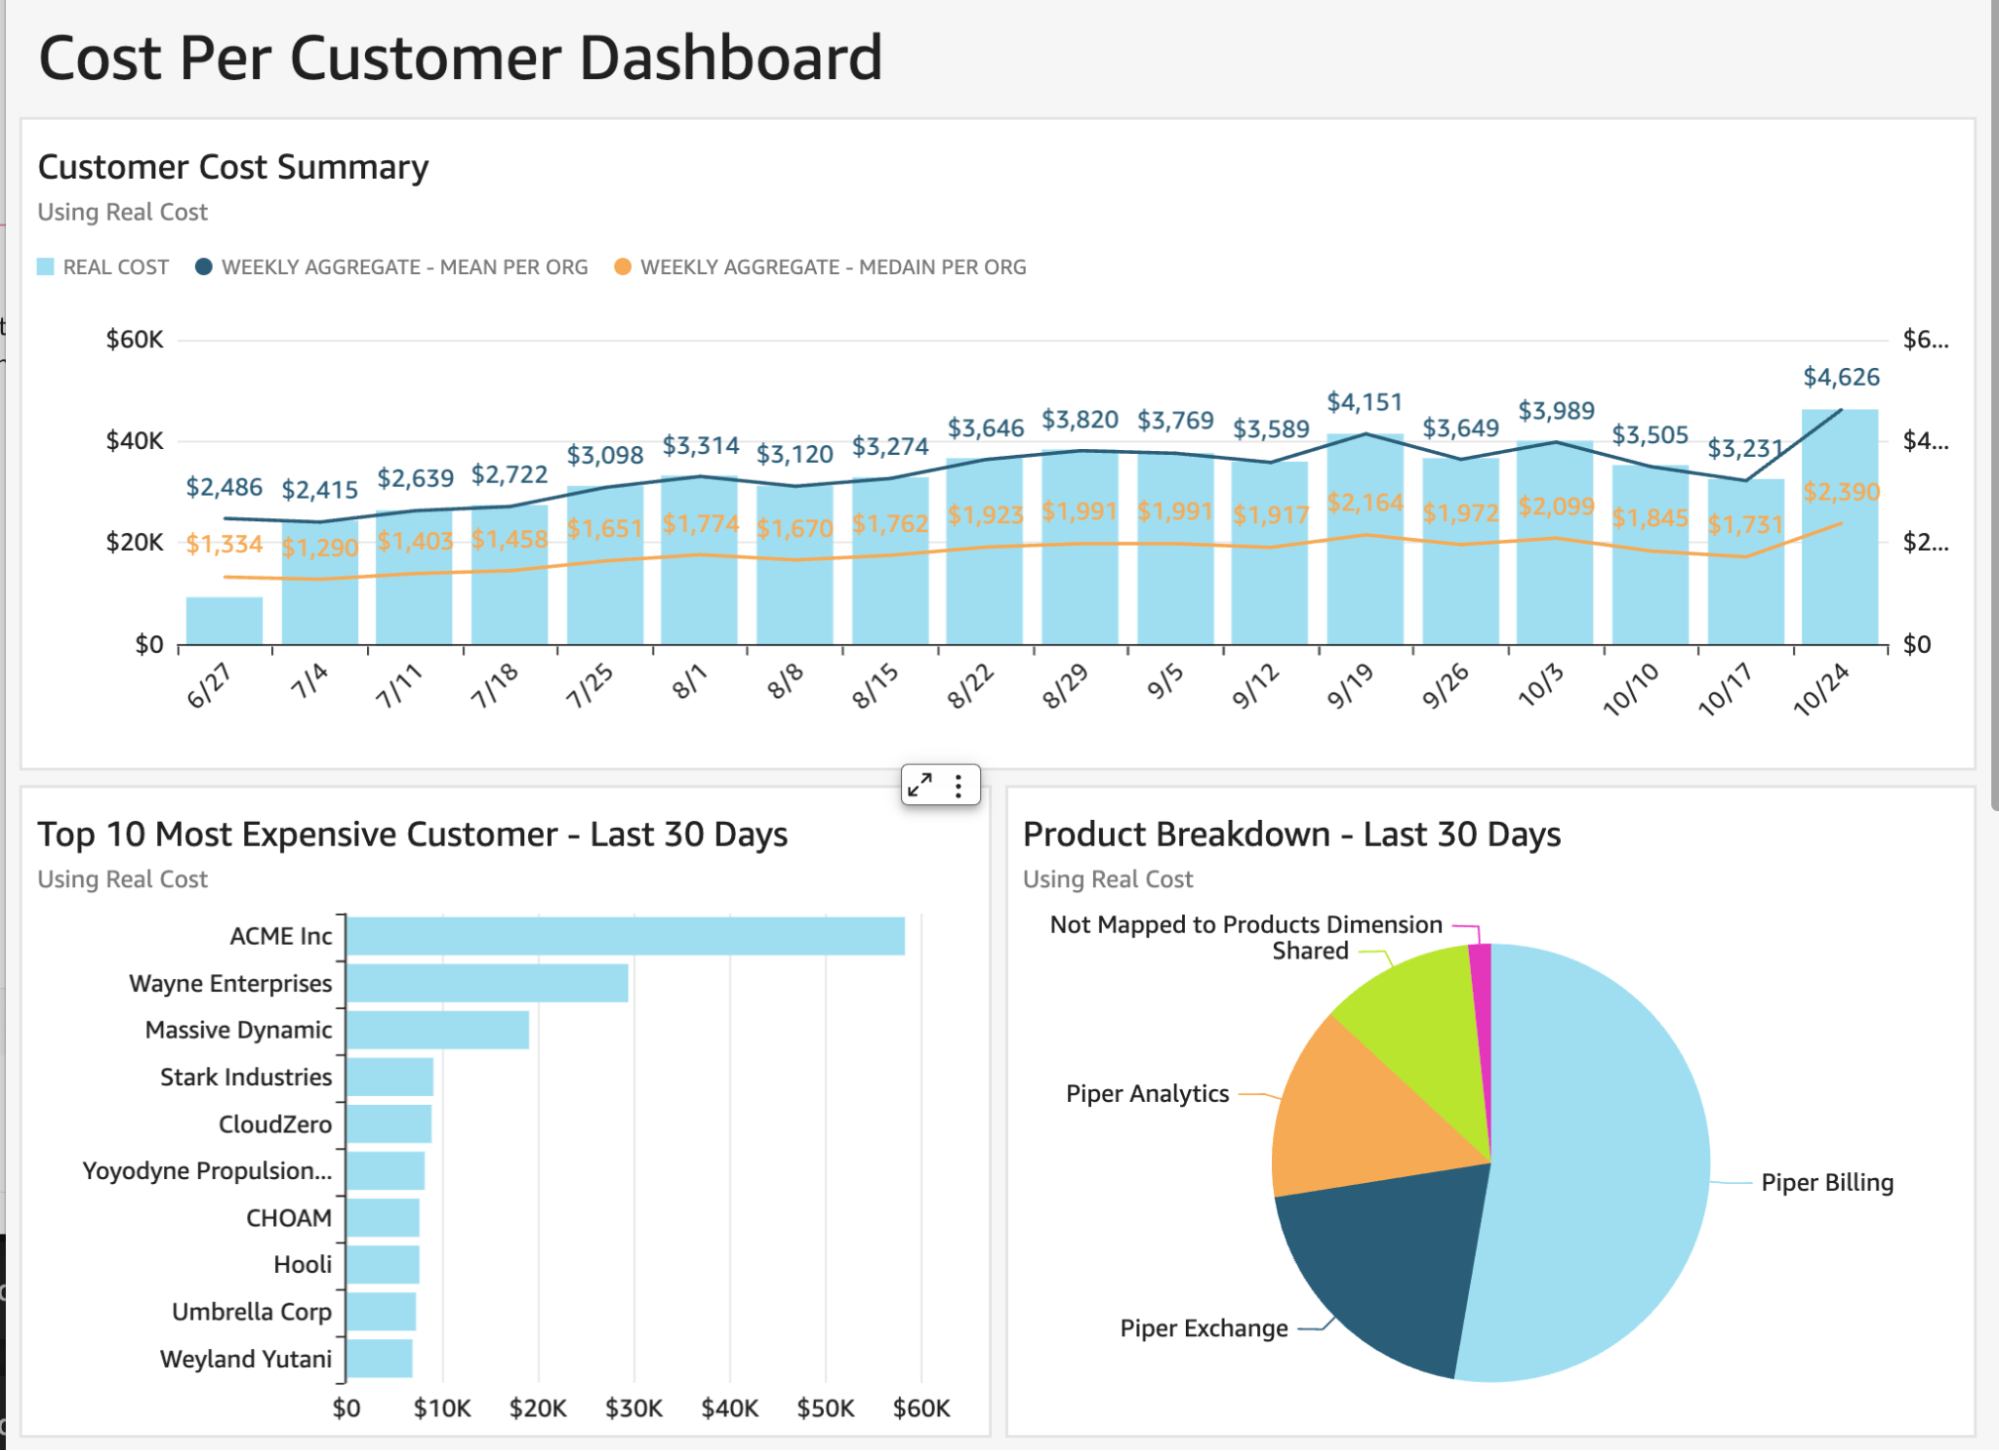
Almost never. Level 1 Metrics are general, and maximum business impact lies in greater granularity. You might be able to see how much each of your products costs, but you don’t necessarily learn how individual customers are using your product — and how that impacts your overall spend.
Assuming you have the resources to dive deeper — and most organizations do — you should.
Do Level 1 Metrics deliver any business impact?
Almost always. Level 1 Metrics give you high-level cost data aligned to the way your business is organized, and show you where to dive deeper.
Example: Imagine a MarTech company with two key business units: a live chatbot and an email automation service. They spend a total of $200,000 on AWS, Snowflake, and New Relic every month. Before getting cost visibility, they assumed that both units — the chatbot and the email automation service — contributed roughly equally to their monthly cloud costs.
But, after unifying data from all cloud providers and SaaS services, then using Cost Per Business Unit as a Level 1 Metric, the MarTech company finds that the live chatbot costs $50,000 a month, while the email automation service costs $150,000 a month.
This level of visibility delivers immediate business impact. It corrects their assumptions about their business units’ relative costs, and it introduces some obvious questions:
- Why does email automation cost 3x what the live chatbot costs?
- Are there particularly costly features within the email automation service that are driving up its cost?
- Are there particularly costly customers using the email automation service whose contracts we should renegotiate?
- Are there architectural inefficiencies within the email automation service that we should address?
Answering these questions requires greater granularity — and deepens business impact. To get good answers to these questions, the MarTech company will need three further (Level 2) metrics:
- Cost Per Customer (Per Business Unit)
- Cost Per Product Feature (Per Business Unit)
- Cost Per Product Feature Per Customer (Per Business Unit)
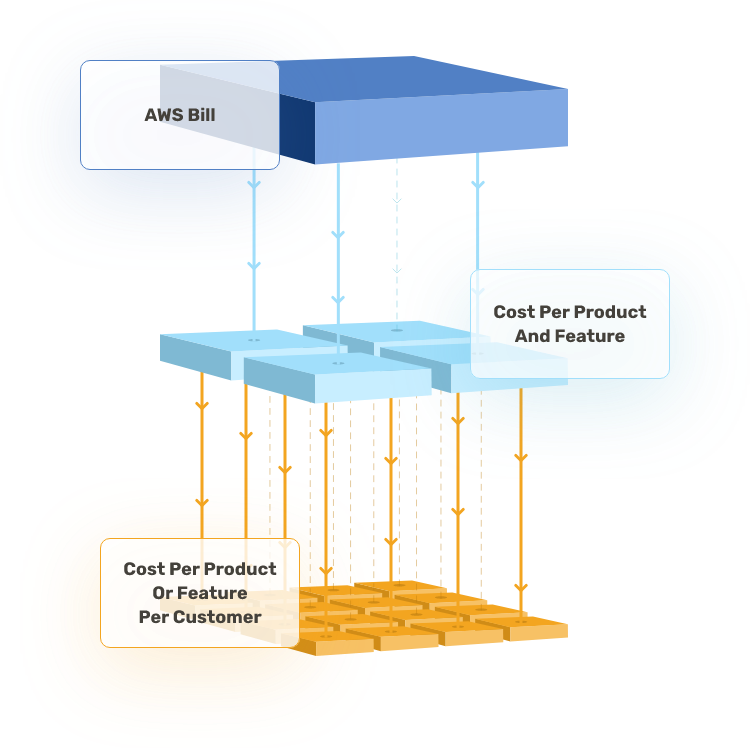 Each additional layer of depth will give the MarTech company a better understanding of what’s driving their cloud costs in each business unit.
It may be that an enterprise customer is using the email automation feature heavily; this gives the company a substantial basis for reevaluating the terms of their contract.
Or, it may be that an architectural inefficiency within one of the email automation service’s features is driving up the unit’s overall cost.
This shows the relevant engineering team a) Where to devote their energies, and b) Best practices for architecture going forward (seeing the cost consequences of different build decisions could reinforce good habits in future feature- and product-building).
To investigate these questions, the MarTech company uses CloudZero’s Unit Cost feature, opting to track the number of emails and chats sent per customer.
With a simple query to the company’s data warehouse, a telemetry stream with this data flows into CloudZero each day. Without changing one line of production code, the company gets distinct Cost Per Customer data for each product.
With accurate per-customer cost data, the company can determine:
- How much cost each customer is driving
- The margins they’re getting on each customer
- Come renewal time, whether there’s substantial basis for reevaluating the more expensive customers’ contracts
After this level of granularity, CloudZero customers will start to ask more detailed questions:
- Which feature in each product is driving the most spend?
- Are we charging enough for that feature to cover its cost?
The MarTech company endeavors to develop unit cost metrics for the features they believe are driving profit. They quickly discover some metrics are already available in existing logs and data warehouses. To get others, they need a few lines of code.
Based on time and resource availability, they can make intelligent decisions about where to focus their energies. Thus, they start to pull existing metrics and decide to wait on changing code.
The top-down approach gets immediate value from the resources you deploy to collect metrics. Relative to the bottom-up approach, it’s easy to get started, and straightforward to tell where to get more granularity.
Depending on the business impact of these decisions, the MarTech company could stop at this level or plan another sprint.
If necessary, the company could eventually get to instrumenting every resource (like a bottom-up approach) — but they don’t have to start there, and they could get loads of value well before getting there.
Maximum Business Impact = The Perfect Balance Of Resources Invested And Value Derived
The central tradeoff is that getting more granularity means investing more resources. It takes time to assess the data you get from Level 1 Metrics, decide which questions you need answered, and develop systems for getting answers. (And yes, it also takes a more substantial capital investment.)
At each new layer of depth, here’s how you should and shouldn’t assess the value of the investment:
- DON’T ask: Were we able to achieve a greater level of metrical depth?
- DO ask: Did the deeper metrics inform more impactful business decisions? Can we quantify the time and money invested vs. the time and money earned/saved?
There’s no universal answer to whether or not you’ve gone deep enough. It always depends on your business context. If you’re a startup that just finished a successful Series B, you might be able to raise the amount of money you’re devoting to cloud metrics.
If you’re trying to weather a market downturn, you might curb your investment and make do with your existing level of metrical depth.
As with all FinOps objectives, the point is iteration: Build systems for getting meaningful cost data, and refine them over time.
Unlike a car trip, cost visibility is not like driving to a single destination. It’s more like the scientific quest to find smaller and smaller units of matter:
Person → Blood cell → Nucleus → Protein → Atom → Proton → Quark → Boson
If you’ve got enough resources, you can always dive deeper. The question for businesses is whether seeing your data at the Quark level is that much more impactful than seeing it at the Atomic level — however intriguing the view might be.
The power of top-down allocation is that it gives you the flexibility to go as deep as is beneficial for you.
