Metrics are crucial to maintaining efficiency, managing costs, and ensuring the health of cloud resources. Amazon CloudWatch can track over 100+ metrics by default across many AWS services such as EC2, RDS, Lambda, S3, and more.
In this guide, we’ll explain the different types of CloudWatch metrics and how to set them up. We’ll also help you understand how to manage and optimize expensive CloudWatch logs through a cost intelligence approach.
But first…
What Is AWS Cloudwatch?
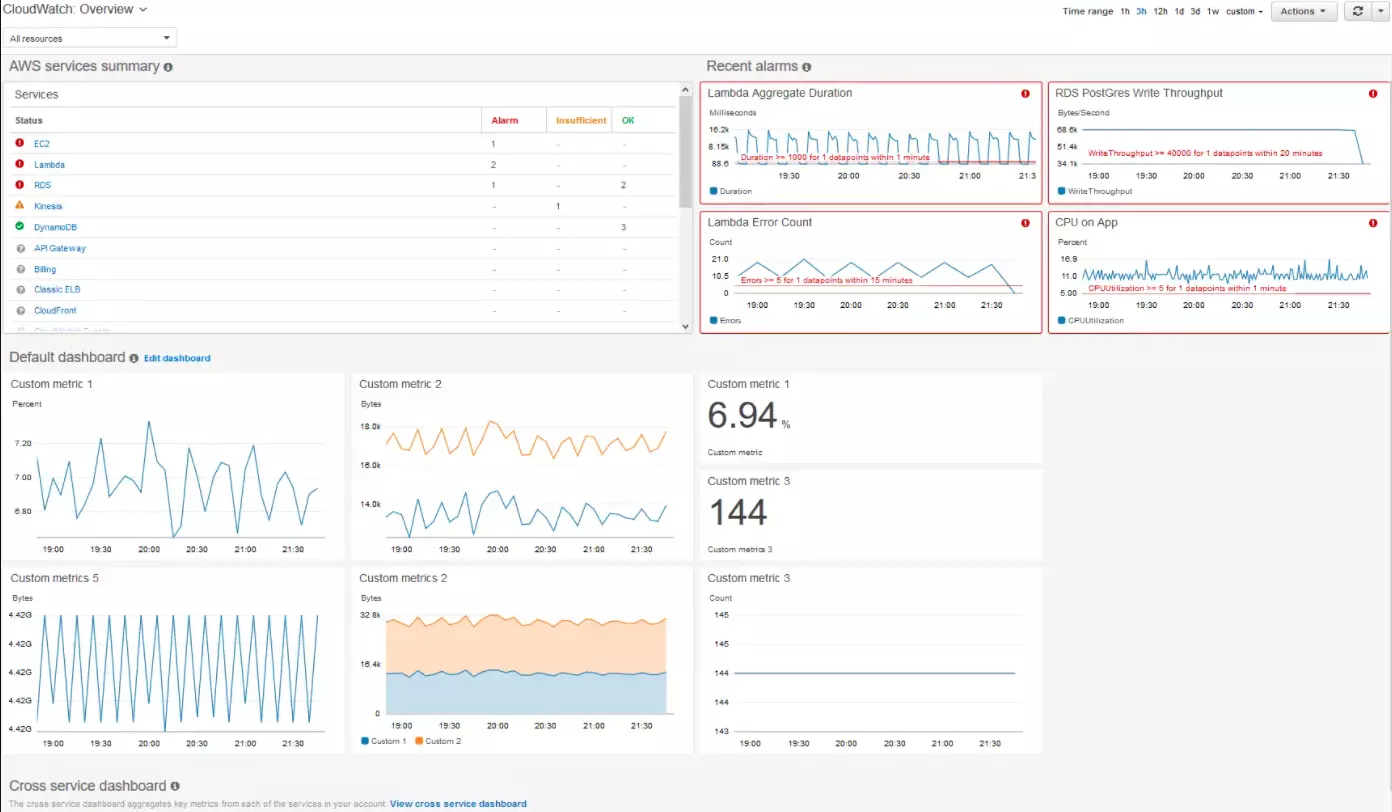
AWS CloudWatch is a tool that offers real-time monitoring of AWS resources and applications. It enables users to:
- Collect and track metrics for monitoring system performance
- Store and access logs to review system behavior over time
- Create alarms based on custom thresholds for critical metrics
- Analyze real-time data to improve application performance
- Correlate metrics and logs to identify issues fast
- Visualize data through customizable dashboards
- Monitor hybrid environments with both on-premises and cloud resources
- Receive notifications for system or application anomalies
- Optimize resource usage by identifying inefficiencies
Read our detailed guide on CloudWatch pricing.
Understanding The Different Types Of CloudWatch Metrics: Basic Vs. Detailed Vs. Custom Monitoring
CloudWatch offers three main metrics: basic, detailed, and custom metrics. Each serves a different purpose based on the level of visibility and control needed.
1. Basic monitoring
Basic monitoring is automatically enabled for most AWS services, offering free metrics at five-minute intervals. This level of monitoring helps you understand trends over time, such as average CPU usage, network traffic, and request rates. However, it may not be sufficient for applications that need more granular, real-time data.
Pros
- Free for most AWS services
- Suitable for non-critical applications
- Provides essential metrics at a reasonable interval
Cons
- Lacks granularity for high-demand applications
- Can miss short-term performance issues
2. Detailed monitoring
Detailed monitoring is a paid option that offers one-minute intervals for metrics instead of five minutes. It is ideal for mission-critical applications that need near real-time data for rapid decision-making. It is also useful for autoscaling purposes, and it improves data granularity.
Pros
- Improved autoscaling
- Faster incident response
- Comprehensive visibility
Cons
- Comes with an added cost
- Higher resource usage
- May result in data overload if not managed
3. Custom metrics
With custom metrics, you can push application-specific data, such as performance indicators, user activity, or business metrics, to CloudWatch using AWS SDKs or APIs.
For example, on an e-commerce platform, you could track user logins or checkout rates as custom metrics and visualize them alongside AWS resource data. This flexibility enables you to go beyond infrastructure monitoring and focus on application-level insights, with the ability to set alarms, visualize data, and automate actions.
Pros
- Smooth AWS integration
- Customizable dashboards
- Flexible monitoring
- Automated responses
Cons
- Incurs extra charges
- Management overhead
Key Cloudwatch Metrics To Track
Here’s a table with over 30 key CloudWatch metrics across some of the popular AWS services:
|
Service |
Metric name |
Description |
|
CPU utilization |
Percentage of allocated EC2 instance CPU being used. | |
|
NetworkIn |
Number of bytes received by the instance on all network interfaces. | |
|
NetworkOut |
Number of bytes sent out on all network interfaces. | |
|
DiskReadOps |
Count of read operations from an EC2 instance’s disk. | |
|
DiskWriteOps |
Count of write operations to an EC2 instance’s disk. | |
|
VolumeReadOps |
Count of read operations on the EBS volume. | |
|
VolumeWriteOps |
Count of write operations on the EBS volume. | |
|
VolumeReadBytes |
Number of bytes read from the EBS volume. | |
|
VolumeWriteBytes |
Number of bytes written to the EBS volume. | |
|
VolumeQueueLength |
Number of operations waiting to be completed. | |
|
Invocations |
Number of times the Lambda function is invoked. | |
|
Duration |
Time taken for a Lambda function to complete execution. | |
|
Throttles |
Number of times a Lambda invocation was throttled. | |
|
Errors |
Number of errors that occurred while invoking the function. | |
|
IteratorAge |
Age of the last record for a stream-based invocation. | |
|
BucketSizeBytes |
Total size of the objects in the bucket. | |
|
NumberOfObjects |
Total number of objects in the bucket. | |
|
4xxErrors |
Number of HTTP 4xx client-side error responses. | |
|
5xxErrors |
Number of HTTP 5xx server-side error responses. | |
|
HealthyHostCount |
Number of healthy instances in the load balancer. | |
|
UnHealthyHostCount |
Number of unhealthy instances in the load balancer. | |
|
RequestCount |
Total number of requests handled by the load balancer. | |
|
Latency |
Time it takes for a request to be processed by the load balancer. |
CloudWatch also tracks other metrics, such as memory utilization, which shows how much memory your instances use. Although this isn’t enabled by default, it provides crucial insights.
SwapUsage helps monitor virtual memory usage, indicating potential performance slowdowns. Both metrics will allow you to prevent resource exhaustion before it impacts performance.
Metrics such as DiskSpaceUtilization track storage use, ensuring instances don’t run out of space. I/OWaitTime measures how long the CPU waits for I/O operations, revealing whether storage devices affect performance.
Additionally, BurstBalance helps monitor burstable instances, ensuring they have enough CPU credits to maintain performance.
How To Set Up Custom Metrics In CloudWatch
Here are the steps to set up custom metrics in CloudWatch:
1. Install the AWS CLI or SDK. Before setting up custom metrics, ensure you have either the AWS CLI or an AWS SDK (like Python, Node.js, or Java) installed. The AWS CLI simplifies sending custom metric data from your local or server-side environment.
2. Create a custom namespace. Custom metrics need to be organized in a namespace that you define. This namespace helps differentiate between standard and custom metrics.
For example, you can name the namespace “MyApplicationMetrics” to categorize your custom metrics.
3. Send data using AWS CLI. To send custom metric data, use the AWS CLI `put-metric-data` command. Here’s a sample command to send data to CloudWatch:
aws cloudwatch put-metric-data –metric-name CustomMetricName –namespace MyApplicationMetrics –value 100
In this command:
– `–metric-name` defines the name of the metric (e.g., “CustomMetricName”).
– `–namespace` is the custom namespace (e.g., “MyApplicationMetrics”).
– `–value` is the value of the metric (e.g., 100).
4. Define dimensions (optional). You can add dimensions to track custom metrics in specific contexts (e.g., instances or services). Dimensions allow for fine-grained monitoring. To include dimensions in the `put-metric-data` command, specify them like this:
aws cloudwatch put-metric-data –metric-name CustomMetricName –namespace MyApplicationMetrics –value 100 –dimensions InstanceId=i-1234567890abcdef
This tracks the custom metric per specific instance ID.
5. Set units for your custom metric (optional). Custom metrics can also have units like `Seconds,` `Bytes,` `Percent,` and more. Specifying a unit helps CloudWatch display the metric appropriately. Here’s how to set the unit:
aws cloudwatch put-metric-data –metric-name CustomMetricName –namespace MyApplicationMetrics –value 100 –unit Percent
6. View custom metrics in the CloudWatch console. Once you’ve sent your custom metrics, you can view them in the CloudWatch Console. Go to the Metrics section, select the appropriate namespace (e.g., “MyApplicationMetrics”), and view your custom metrics.
7. Set alarms for custom metrics. After sending custom metrics, you can set alarms to monitor their thresholds. In the CloudWatch Console, navigate to Alarms, create a new alarm, select your custom metric, and define the thresholds for alerting.
How To Visualize And Set Up Notifications For CloudWatch Metrics
Visualizing CloudWatch metrics is simple through the CloudWatch Console. Navigate to the Metrics section, select your service or custom namespace, and choose the desired metrics. You can then create dashboards to view multiple metrics at a glance. Custom graphs and charts help track performance trends over time, ensuring you stay on top of resource usage and health.
To set up notifications, create Alarms in CloudWatch. Go to the Alarms section, select your metric, and define thresholds for when an alarm should trigger, for instance, when CPU utilization exceeds 80%. You can integrate alarms with SNS (Simple Notification Service) to send alerts via email, SMS, or other services, ensuring immediate response to critical events. This proactive monitoring helps maintain performance and prevent issues before they escalate.
Essential CloudWatch Practices To Implement Immediately
Now that you know some key metrics for various AWS services, here are best practices to improve monitoring efficiency, reduce manual effort, and help maintain cost-effective CloudWatch usage.
- Aggregate logs with log groups. Organize logs into log groups for easier management and analysis. This helps consolidate logs from multiple services and simplifies querying.
- Use dimensions effectively. Leverage dimensions to contextualize your metrics, such as tracking by instance ID or availability zone. This enables you to break down performance by critical identifiers.
- Automate responses with alarms. When alarms are triggered, automate actions such as scaling resources or restarting instances. This improves responsiveness and reduces manual intervention during critical events.
- Consolidate logs with AWS CloudWatch Agent. Install the CloudWatch Agent to collect system-level metrics and logs from on-premises or hybrid environments, consolidating monitoring across your infrastructure.
- Regularly audit metrics and alarms. Periodically review your metrics and alarms to ensure they are still relevant. Update thresholds and add new alarms as your infrastructure evolves.
- Set retention policies for logs. Log retention policies can be configured to automatically delete logs after a certain period. This helps control costs and ensures that outdated logs don’t accumulate.
- Optimize costs by filtering unnecessary logs. Avoid logging every event. Log filters capture only relevant data, reduce log volume, and keep costs under control.
How To Understand, Manage, And Optimize CloudWatch Costs With CloudZero
Excessive data points, log retention, and detailed monitoring are some of the major culprits behind surprise bills in CloudWatch. To reduce CloudWatch costs, you can:
- Consolidate your metrics and only monitor what is necessary.
- Disable detailed monitoring for non-critical services or increase the interval for metric collection.
- Implement log retention policies, ensuring you only retain logs as long as needed.
- Delete old logs to reduce storage costs.
- Filter logs to minimize storage volume while keeping valuable insights.
AWS native tools like CloudFormation and Lambda can also automate cleaning up old logs and managing metric retention policies.
However, you will need a third-party platform for deeper cost visibility, advanced automation, and custom reporting.
Enter CloudZero
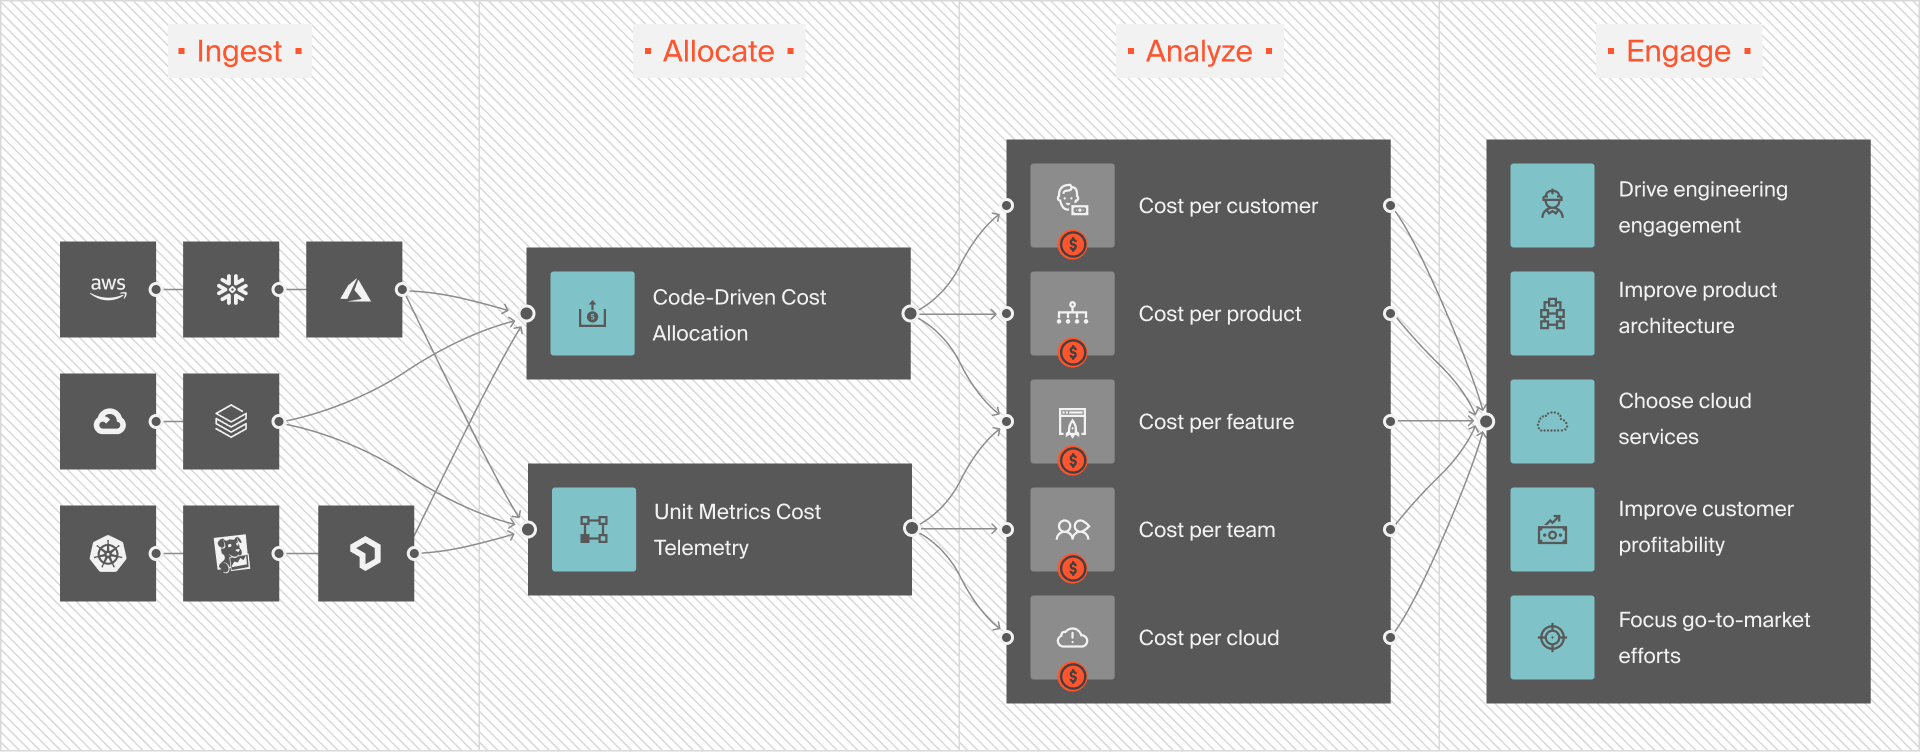
CloudZero is a cost intelligence platform that manages and optimizes AWS costs. With CloudWatch, it identifies expensive log groups and offers real-time alerts when log costs spike. CloudZero also provides insights into which logs drive costs, allowing you to delete unnecessary logs or adjust retention policies.
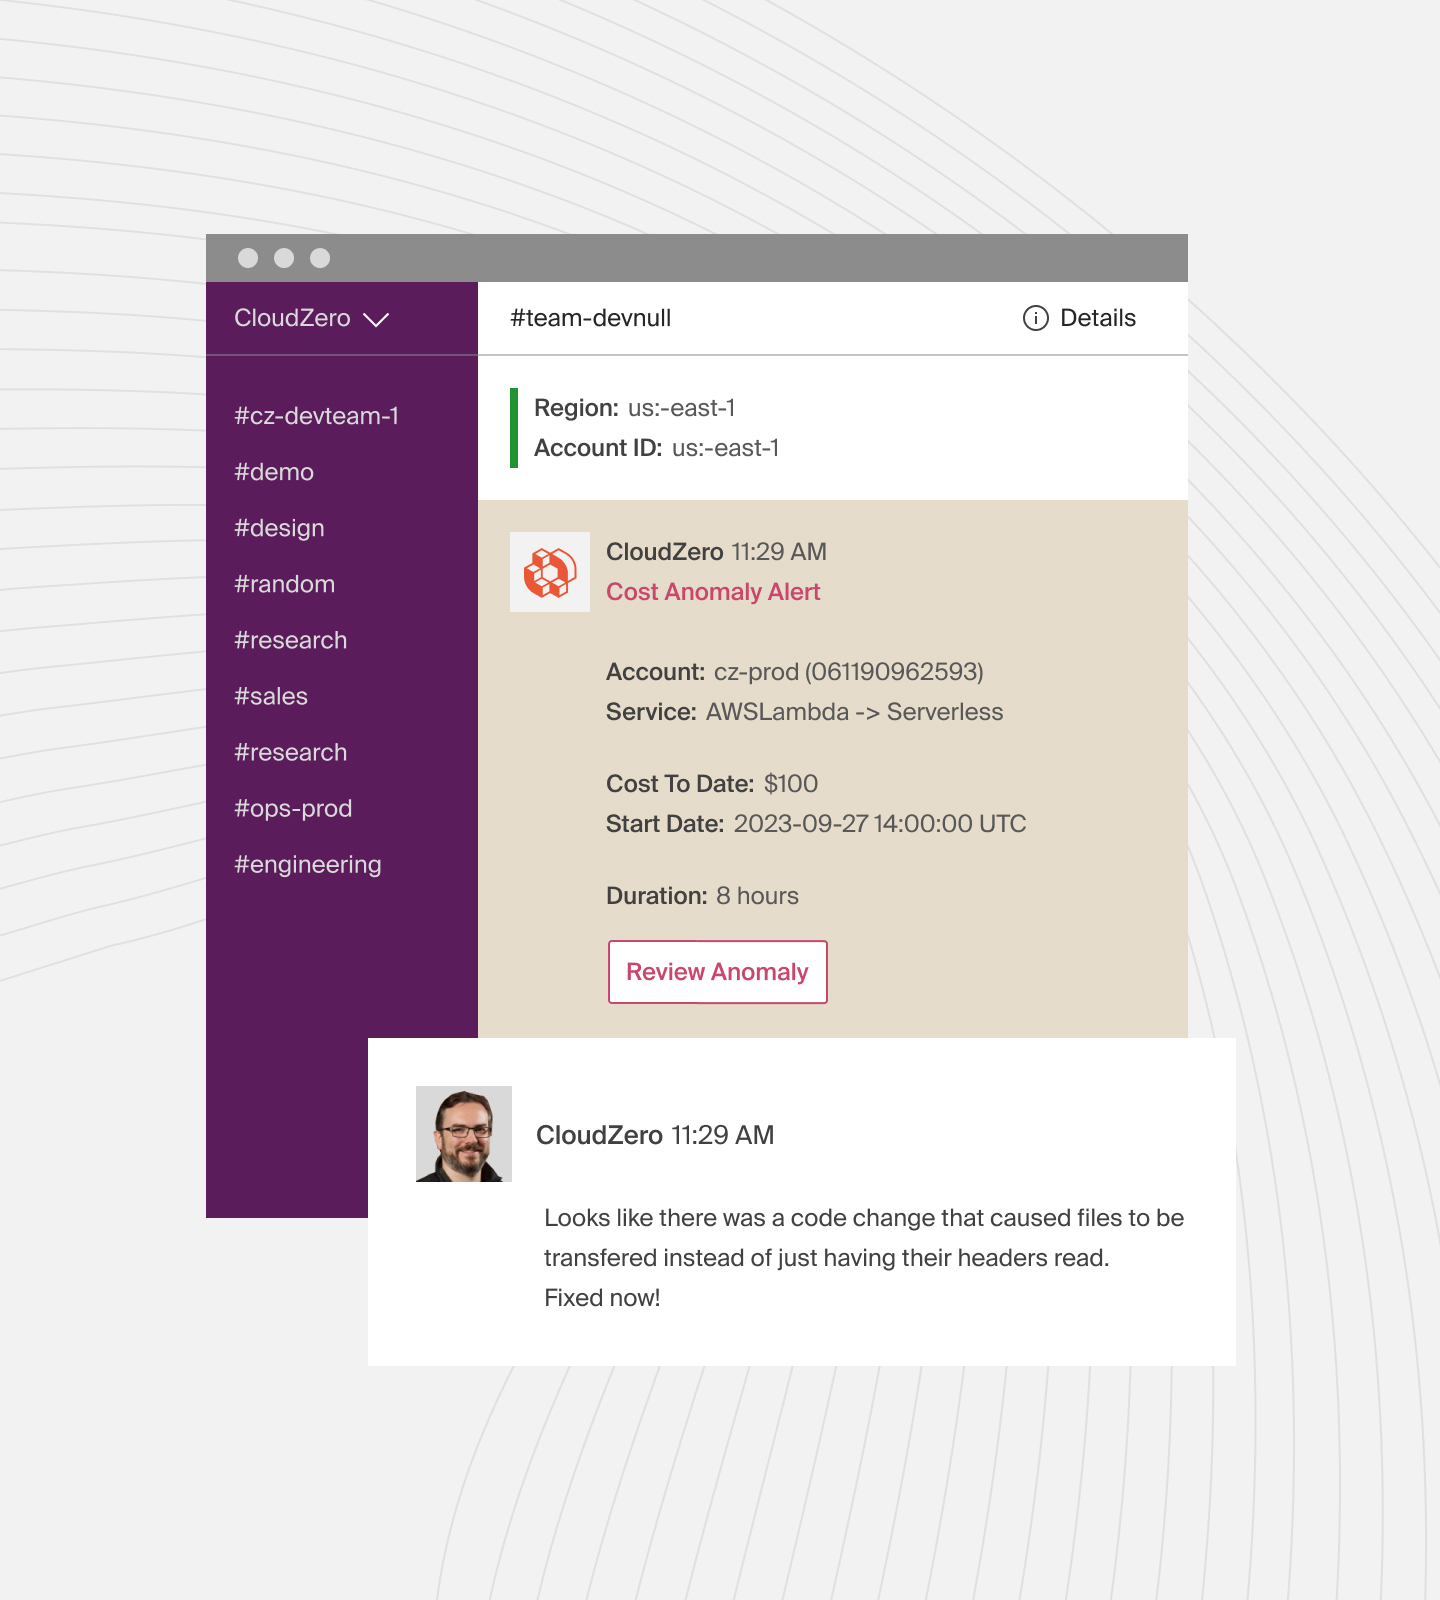
CloudZero integrates cost monitoring into engineering workflows by sending real-time Slack alerts for cost anomalies. This gives teams visibility into CloudWatch metrics, driving cost-informed decisions — such as tracking more metrics or retaining logs.
The platform also enables you to create custom dashboards to track costs per feature, customer, or team. It offers granular insights into how CloudWatch usage affects overall spending, helping you forecast and optimize costs without losing essential visibility.
 to see how CloudZero gives you control over your AWS costs.
AWS CloudWatch FAQs
What are CloudWatch metrics?
CloudWatch metrics are data points that represent system performance, such as CPU usage, network activity, or disk operations.
What are the golden signals of CloudWatch?
The golden signals are latency, traffic, errors, and saturation. These help monitor system health and performance.
What are the three states of the CloudWatch metric alarm?
The three states are OK, Alarm, and Insufficient Data.
Is CloudWatch free?
CloudWatch offers a free tier with limited metrics and logs, but charges apply for additional usage and features.
