
Data overload. Poor decision-making. Inefficient processes. Limited real-time insights. These are just a few of the many challenges an organization would face without business intelligence (BI).
Yet traditional BI has its own set of challenges, including complexity, cost, data diversity, and more. These limitations have led businesses to seek a more affordable and efficient solution — the cloud.
This article explains cloud business intelligence (cloud BI), how it works, and its benefits. We’ll also introduce the best cloud BI tools, organized into several categories so you can find the best tools based on your business needs.
What Is Cloud BI?
Cloud BI combines the power of business intelligence with cloud computing. It enables businesses to collect, process, and analyze data without needing physical servers or on-site infrastructure. Instead, all data storage and processing happen in the cloud, making it accessible from anywhere, anytime.

How Does Cloud BI Work?
Traditional BI systems are usually deployed to the cloud using public, private, and hybrid models.
Public
In a public cloud deployment, BI tools and data are hosted on a cloud provider’s infrastructure, such as AWS, Azure, Google Cloud, or Oracle. This eliminates the need for on-premises servers and is one of the most popular, cost-effective cloud BI solutions.
Private Cloud
In a private cloud deployment, organizations either maintain a private cloud on-premises (virtualized) or host it on a cloud provider’s dedicated infrastructure. Only the company’s BI systems and data are stored in this private environment, offering more security and control.
Hybrid Cloud
Here, organizations can split their BI workloads across both public and private clouds. Data can be stored locally or in a private cloud for security. On the other hand, data processing, reporting, and dashboards can be handled in a public cloud for cost savings and flexibility.
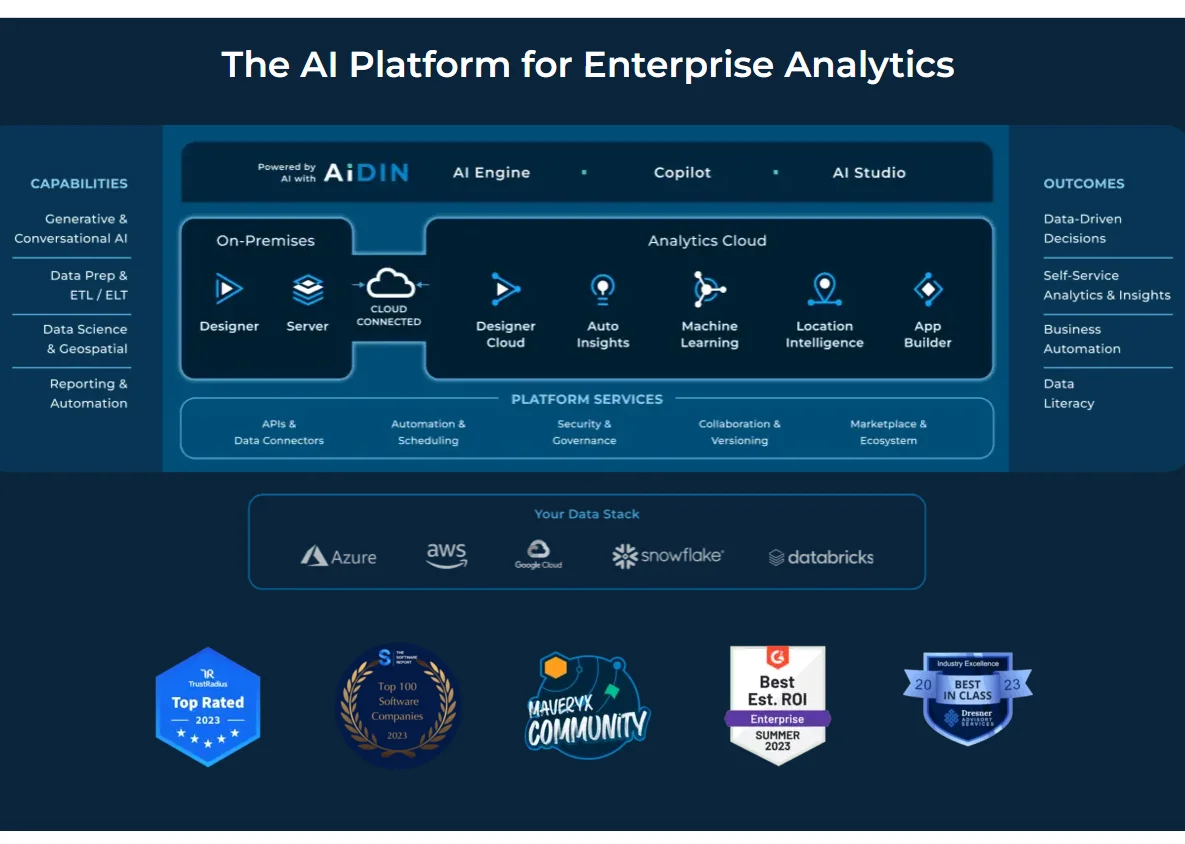
The trend of moving BI tools to the cloud is growing rapidly. A Dresner Advisory Services study shows that 54% of businesses consider cloud BI essential for both current and future operations. Why?
Benefits Of Cloud BI
Cloud BI offers many advantages that improve business operations across the board. Some of the key benefits include:
- Improved decision-making. Access to real-time data supports faster, more informed business decisions.
- Cost efficiency. No need for expensive on-premises servers. Most cloud BI also offer flexible, pay-as-you-go pricing.
- Scalability. Cloud BI platforms can easily scale resources depending on your business needs without heavy infrastructure investment.
- Accessibility. Teams can access BI tools and data from anywhere, facilitating collaboration.
- Data Integration. Cloud BI tools integrate with many data sources and cloud services, improving data consistency and accessibility.
- Automatic updates. Cloud BI platforms are updated regularly by the provider. This ensures you always have the latest features without managing software upgrades.
- Robust security. Most cloud BI platforms offer advanced security features, including encryption, access controls, and compliance with industry standards.
But to fully realize these benefits, you need to know which metrics to track.
Metrics Cloud Business Intelligence Tools Should Measure
Cloud BI tools track a wide range of metrics that help businesses make informed decisions and optimize operations.
Cost metrics
Cloud BI tools track and analyze cloud spending across departments and services to ensure cost efficiency. They also measure the cost incurred for acquiring and serving customers (cost per customer). A perfect example is CloudZero. The platform tracks cost per customer by linking cloud costs to specific customer activity. This helps businesses understand precisely how much it costs to serve each customer based on usage.
Performance metrics
A crucial metric is the customer lifetime value CLV). This measures the total revenue a business can expect from a single customer over the lifespan of their relationship. Revenue growth and customer retention rate are also crucial metrics.
Predictive analytics
Cloud BI tools can predict future demand based on historical data. You can also use the tools to identify customers who are likely to stop using your service (churn prediction).
Operational efficiency
Track how efficiently your cloud resources (such as storage and computing power) are used. You should also measure application uptime and availability to ensure smooth operations and minimal disruptions.
Marketing ROI
Measure the ROI from marketing campaigns to understand which efforts generate the highest value.
Data quality metrics
Ensure that the data being analyzed is correct and valid. Additionally, measure whether all necessary data is available and accounted for in data analysis.Most Cloud BI tools are delivered as SaaS platforms.
Read our comprehensive guide on the SaaS metrics to measure.
Best Cloud Business Intelligence ToolsCloud Cost Management
These tools ensure cloud efficiency by deriving actionable insights from business data while controlling and optimizing cloud spending.
1. CloudZero
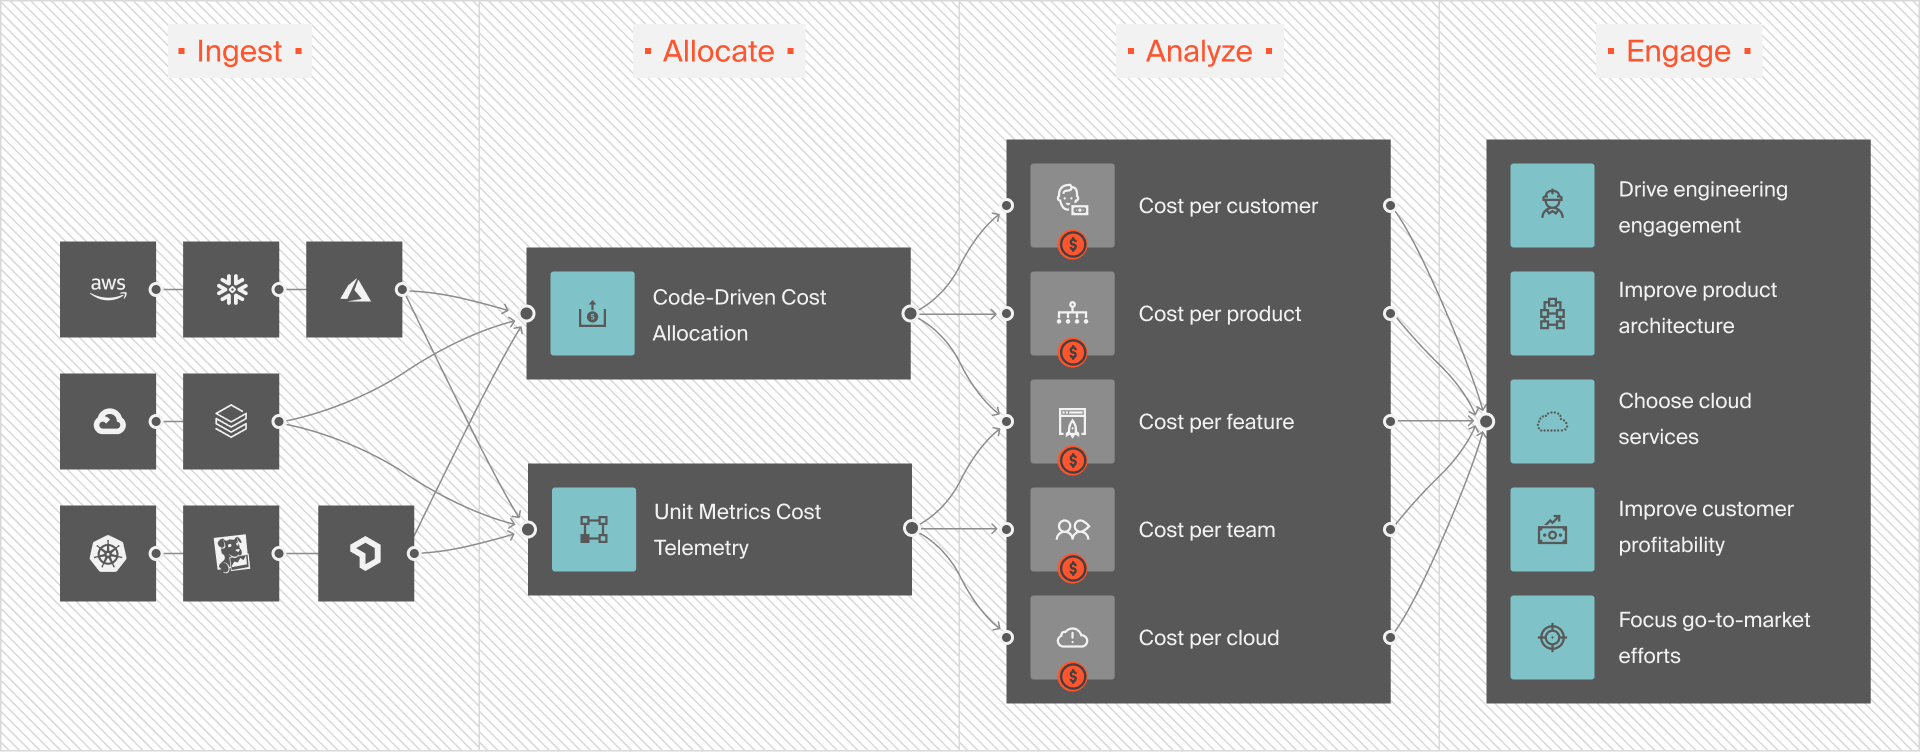
CloudZero leverages cloud infrastructure to deliver the primary aspects of BI in cloud cost management. Cloudzero can:
- Collect data from major cloud platforms and SaaS solutions to provide a single source of truth for cloud costs
- Integrate and organize data using its AnyCost API for streamlined access and analysis
- Analyze cloud costs with detailed metrics such as cost per customer, feature, product, and more
- Visualize, filter, and analyze cloud spending trends through the CloudZero Explorer
- Support decision-making with insights to optimize cloud spending and resource allocation
- Allocate 100% of cloud spend accurately, even if tagging is incomplete, ensuring full cost transparency
- Detect unusual spending patterns or spikes automatically with built-in anomaly detection
- Schedule reports to keep stakeholders informed on cloud spending trends
- Automate insights that highlight potential cost-saving opportunities
Ambitious companies such as Duolingo, Upstart, New Relic, MalwareBytes, and more are using CloudZero to save millions of dollars in cloud spend. Read our customer success stories here. Or, get a free product tour of CloudZero here. You can also  to see CloudZero in action.
2. AWS Budgets
AWS Budgets collects cloud cost-related data from your AWS account. This includes real-time data on costs, usage, and forecasts. It also pulls data from other AWS services to give users a complete view of their cloud spending.
Predictive analytics in AWS Budgets enable users to predict future costs and usage. It offers visibility into trends and helps them anticipate potential overruns.
3. Azure Cost Management
Azure Cost Management collects real-time data on cloud usage and costs across Azure services. It integrates with other Azure tools, providing users with a unified view of all cloud expenditures in one place.
It also retrieves cost data for deeper analysis. Users can automate data exports on a daily, weekly, or monthly basis and store the data in an Azure Storage account for future use.
Azure APIs also support the retrieval of both current and historical billing information, which can be integrated into custom reports, Power BI, or other BI tools.
Data Warehousing
A data warehouse stores and organizes data from multiple sources, making it accessible for analysis. BI then uses this data to perform detailed analysis, generate reports, and create insights that support better decision-making.
Consider the following.
4. Snowflake
Snowflake is a robust data warehouse that stores, manages, and analyzes large amounts of data. It integrates with BI tools such as Tableau and Qlik, allowing for advanced data visualization and in-depth analytics. Through these partnerships, Snowflake empowers users to create interactive dashboards and generate insights from their data quickly.
Snowflake also features AI-driven analytics tools that support predictive insights and automate processes.
5. Amazon Redshift
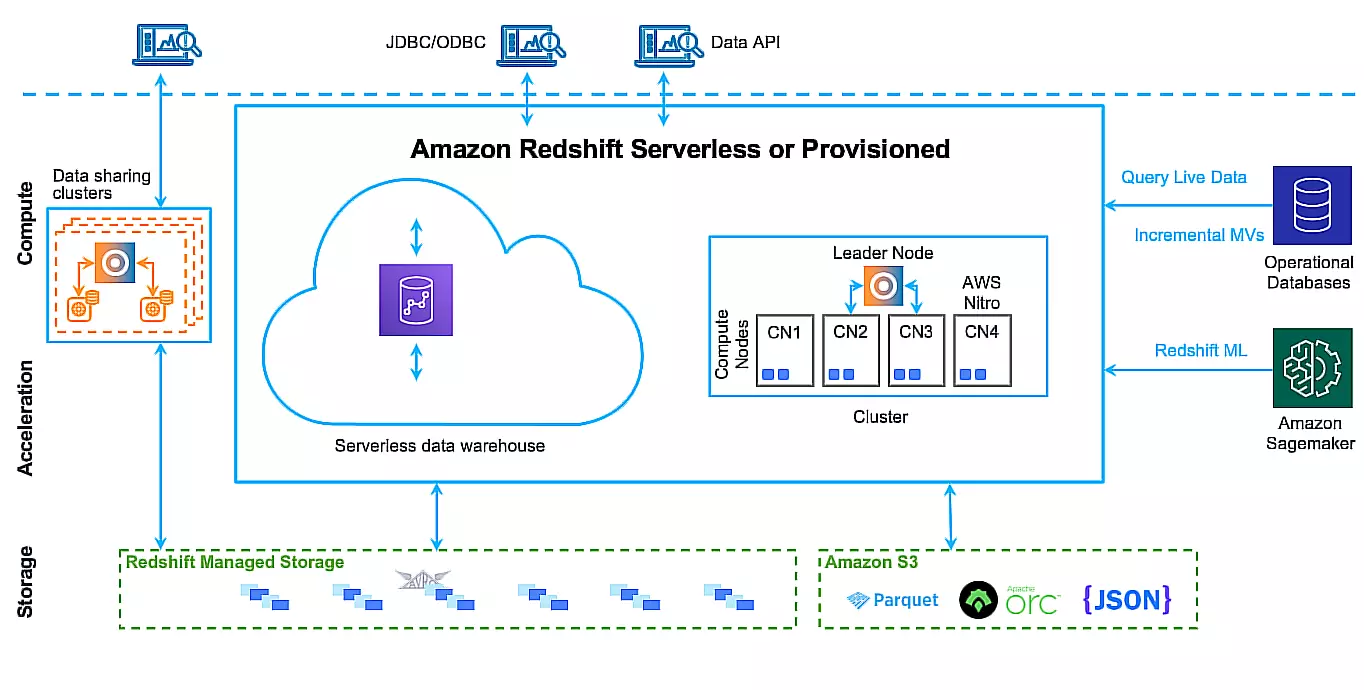
Amazon Redshift is a cloud-based data warehouse. It utilizes an MPP architecture, which enables it to distribute large SQL operations across multiple nodes. This is crucial for BI tasks, as it allows users to run complex queries on massive data with high performance and efficiency.
Its Advanced Query Accelerator (AQUA) feature speeds up query performance by processing data closer to storage. This reduces the need to move data between storage and compute clusters. As a result, tasks like filtering and aggregation are much faster.
Redshift also integrates with Tableau and Power BI to support data visualization and reporting capabilities.
Learn more about Snowflake vs AWS Redshift
6. Databricks
Databricks is an analytics platform that combines the flexibility of a data lake with the structured governance of a data warehouse. This helps data scientists, analysts, and engineers work from a single platform to analyze structured, semi-structured, and unstructured data.
With Databricks, users can also run workloads on its serverless SQL compute. This simplifies data querying, reduces overhead, and allows users to focus purely on data analytics.
Databricks SQL also supports ANSI-SQL, the standard language for querying databases. It enables data practitioners to run queries fast without needing to learn new languages.
Another thing. Databricks integrates dbt, Tableau, Power BI, and Fivetran for data ingestion, transformation, and querying.
Read our complete guide to understand more about data warehouses and data lakes.
Data Visualization and Reporting
In BI, data visualization converts complex raw data into visual formats that can be interpreted and analyzed easily. It enables users to identify and understand patterns, trends, and relationships within the data without needing to dig into raw numbers.
Most cloud BI tools offer real-time dashboards that represent data using charts, graphs, and maps to generate reports. These reports help users track performance metrics and make timely, data-driven decisions.
Here are the best cloud BI solutions with built-in data visualization and reporting.
7. Sisense
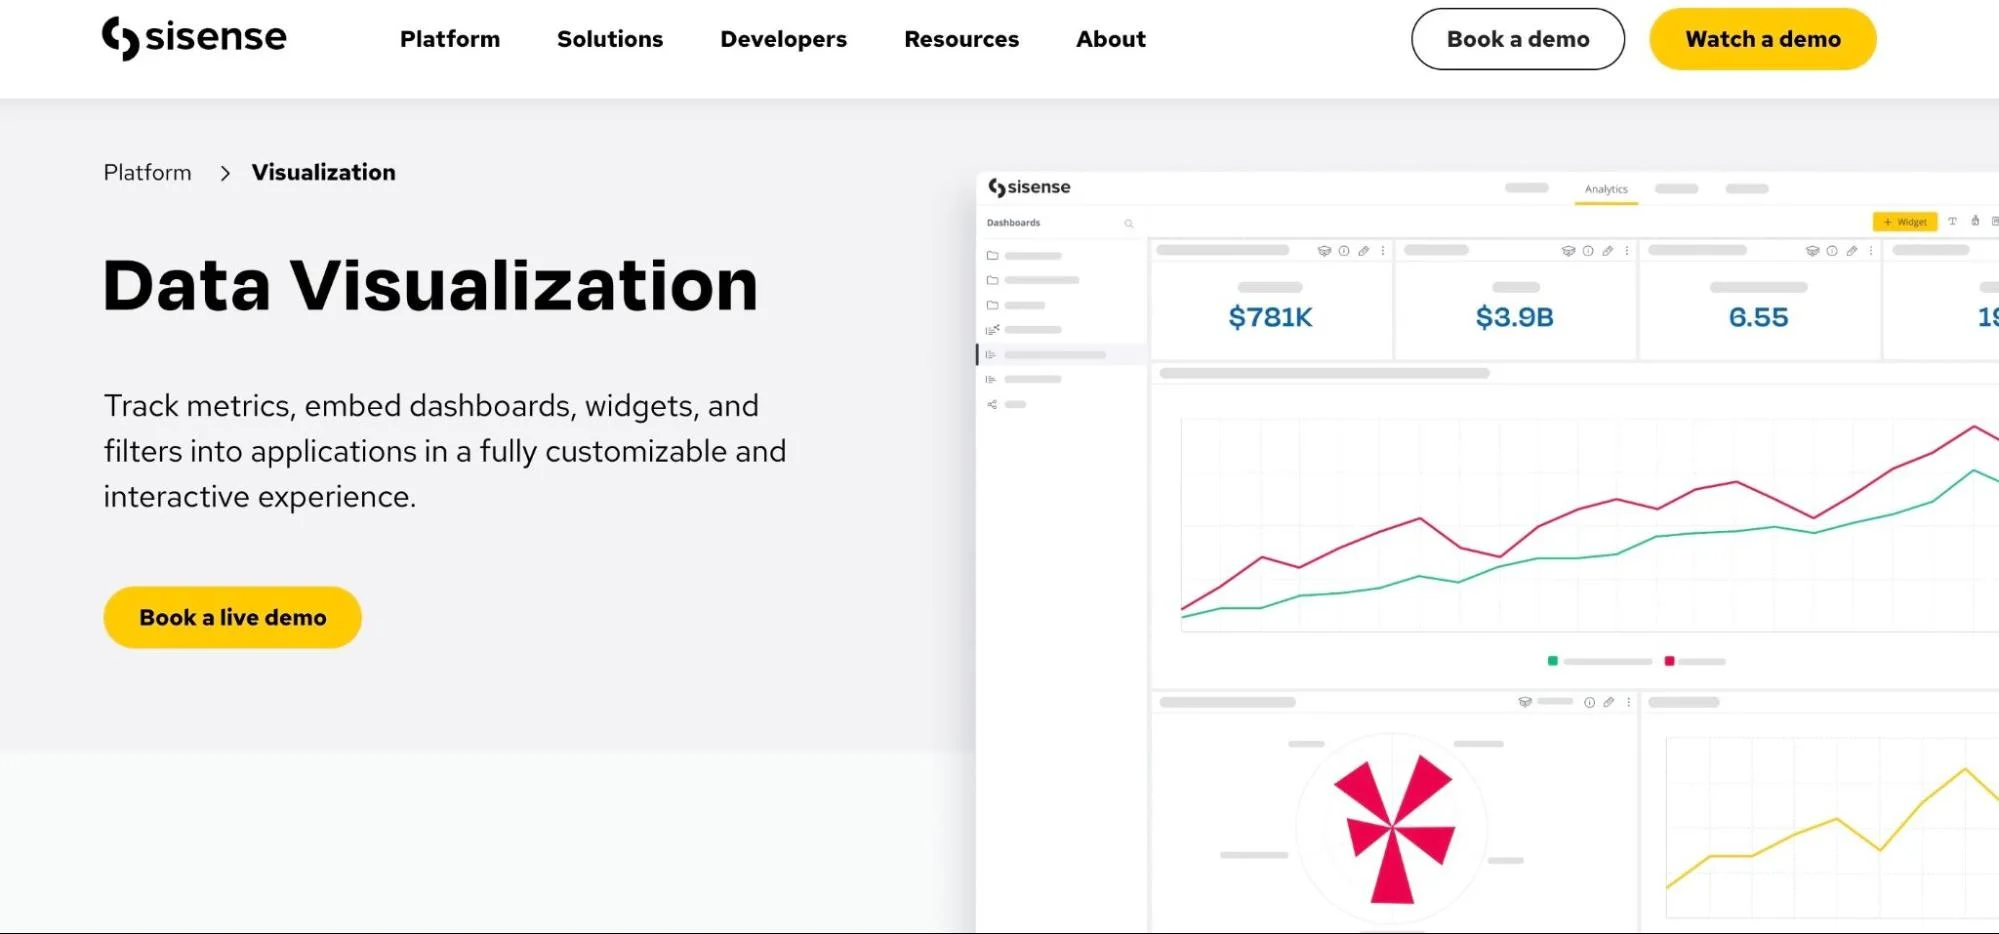
Sisense is a BI and data analytics platform. Users can blend large amounts of data from multiple sources, using either Sisense Live to access data directly or by importing it into the Sisense ElastiCube. This creates a unified data model that combines different data into a single, usable format, streamlining data management.
Once the data is ready, users can interact with it visually to analyze and gain a deeper understanding. The platform offers the ability to build interactive dashboards that feature insights and allow users to take action based on real-time data.
Sisense also offers a customization feature, BloX widget, that supports the development of advanced layouts and the integration of third-party tools, such as Salesforce.
8. Oracle BI
Oracle BI is a suite of tools that perform various BI tasks, from data analysis to reporting.
Oracle BI Publisher, for instance, enables users to build reports with different layouts, including charts, pivot tables, and more. It also supports SQL query-based reports and enables users to create master-detail (parent-child) relationships, which are crucial for structuring data in complex reports. Its data grouping features also allow users to aggregate and structure data more effectively in reports.
Oracle Data Visualization is a self-service tool that enables users to access and work with data independently. It provides drag-and-drop functionality for data analysis and visualization, reducing the need for technical assistance and improves data accessibility.
Oracle BI also includes security controls, data governance, and compliance tools. These help users maintain data security, consistency, and compliance with regulatory standards.
9. SAP BusinessObjects
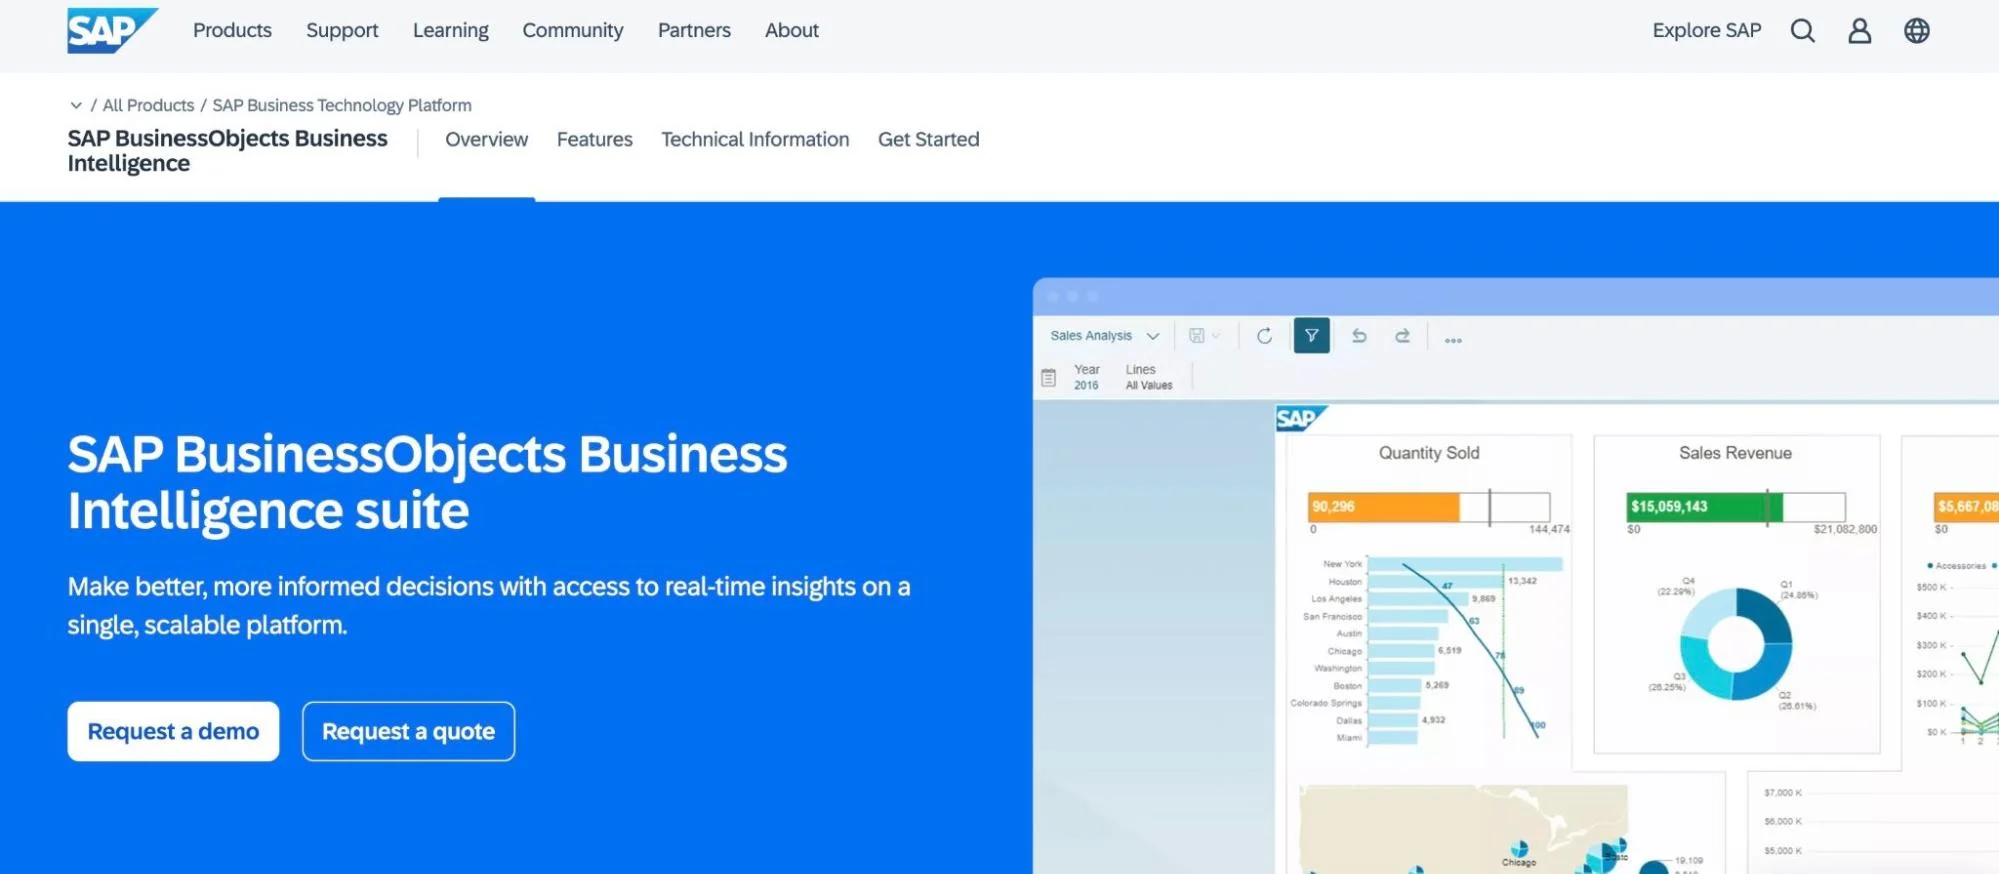
SAP BusinessObjects also features several reporting and analytics tools. The most notable is the SAP BusinessObject Dashboards. It allows users to create customized dashboards to visualize data through charts, graphs, and other interactive elements.
SAP BusinessObjects Explorer and SAP Lumira facilitate self-service data exploration and visualization. They enable users to generate insights without needing extensive technical support. SAP Crystal Reports generate dynamic reports from numerous data sources. It is highly flexible and supports multiple formats.
SAP BusinessObjects is widely used across many industries, including finance and healthcare.
Predictive Analytics
Predictive analytics uses historical data, statistical algorithms, and ML to forecast future outcomes. It identifies patterns within past data and applies them to predict what could happen next. This is useful for businesses that want to forecast demand, personalize marketing, and optimize pricing strategies.
10. IBM SPSS Statistics

IBM SPSS is renowned for building predictive models using advanced statistical techniques. These include regression analysis, decision trees, and time-series forecasting to help users forecast trends.
A critical step in predictive analytics is data preparation, and IBM SPSS also excels at this. It supports data from various sources and ensures it is structured for accurate predictive modeling. Once the data is clean and ready, users can apply predictive models that provide actionable insights.
SPSS also offers real-time scoring, which integrates predictive models into operational systems. This provides up-to-date insights that can drive immediate actions.
11. TIBCO Statistica
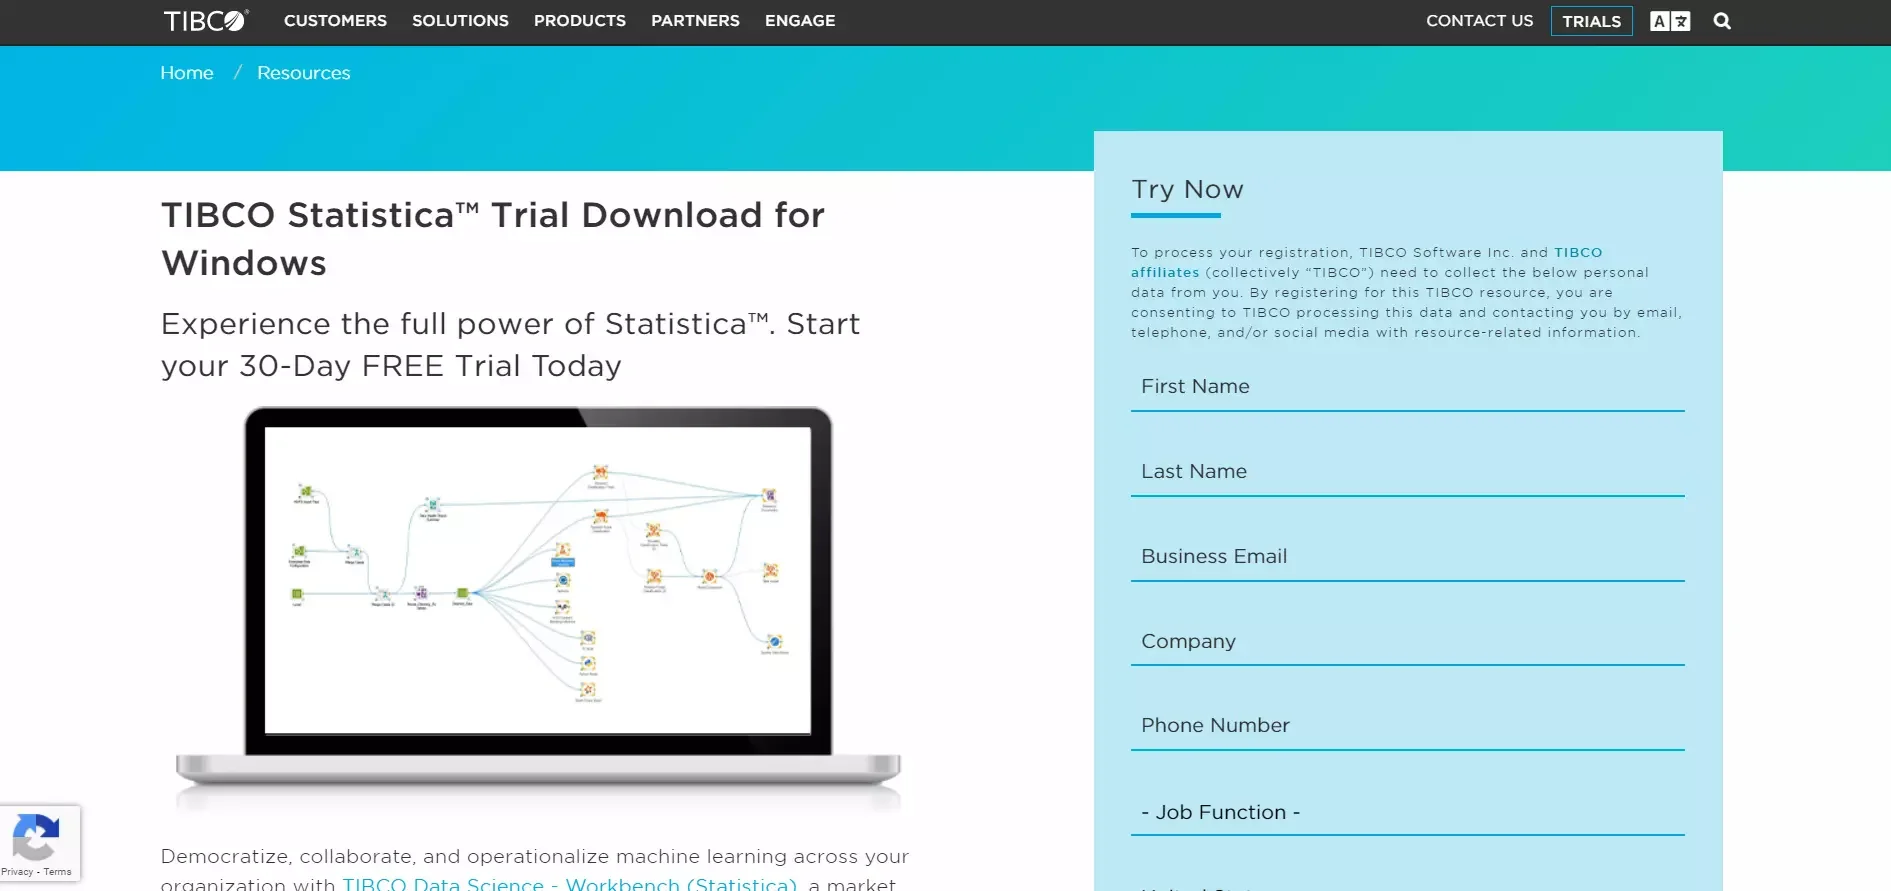
Part of the TIBCO Data Science suite, TIBCO Statistica is a predictive analytics platform. It uses AI algorithms to build analytic workflows.It can be deployed on-premise, in the cloud, or in edge serverless. This is crucial for users needing real-time analytics, such as IoT applications.
Beyond its analytics capabilities, TIBCO Statistica emphasizes team collaboration and governance. It provides a shared environment where teams can develop, test, and deploy models with complete visibility. Its security and auditability features ensure compliance with industry regulations.
The platform also integrates with Azure, Oracle, SAP HANA, and other databases.
12. Alteryx
For predictive analytics using Alteryx, the platform integrates the entire analytics workflow. This includes data access, preparation, modeling, and sharing results, all in one interface. This architecture ensures that analytics are accessible to businesses without the need for multiple tools. Alteryx automates the process so that users can focus on insights rather than technical details.
Alteryx also includes a Predictive Analytics Starter Kit. This offers templates for tasks such as customer behavior forecasting and time-series analysis. The template uses Alteryx’s low-code and no-code tools to enable users to create predictive models even without coding knowledge.
Alteryx also features data visualization and reporting tools.
Data Cleansing
Without clean data, the outputs from BI tools may be inaccurate, leading to poor decision-making. Data cleansing removes duplicate records and incomplete data, corrects errors, and standardizes formats for consistency. It also fills gaps and ensures the data aligns with standards for accurate analysis.
Here are the best cloud BI platforms for data cleansing.
13. SAS Data Quality
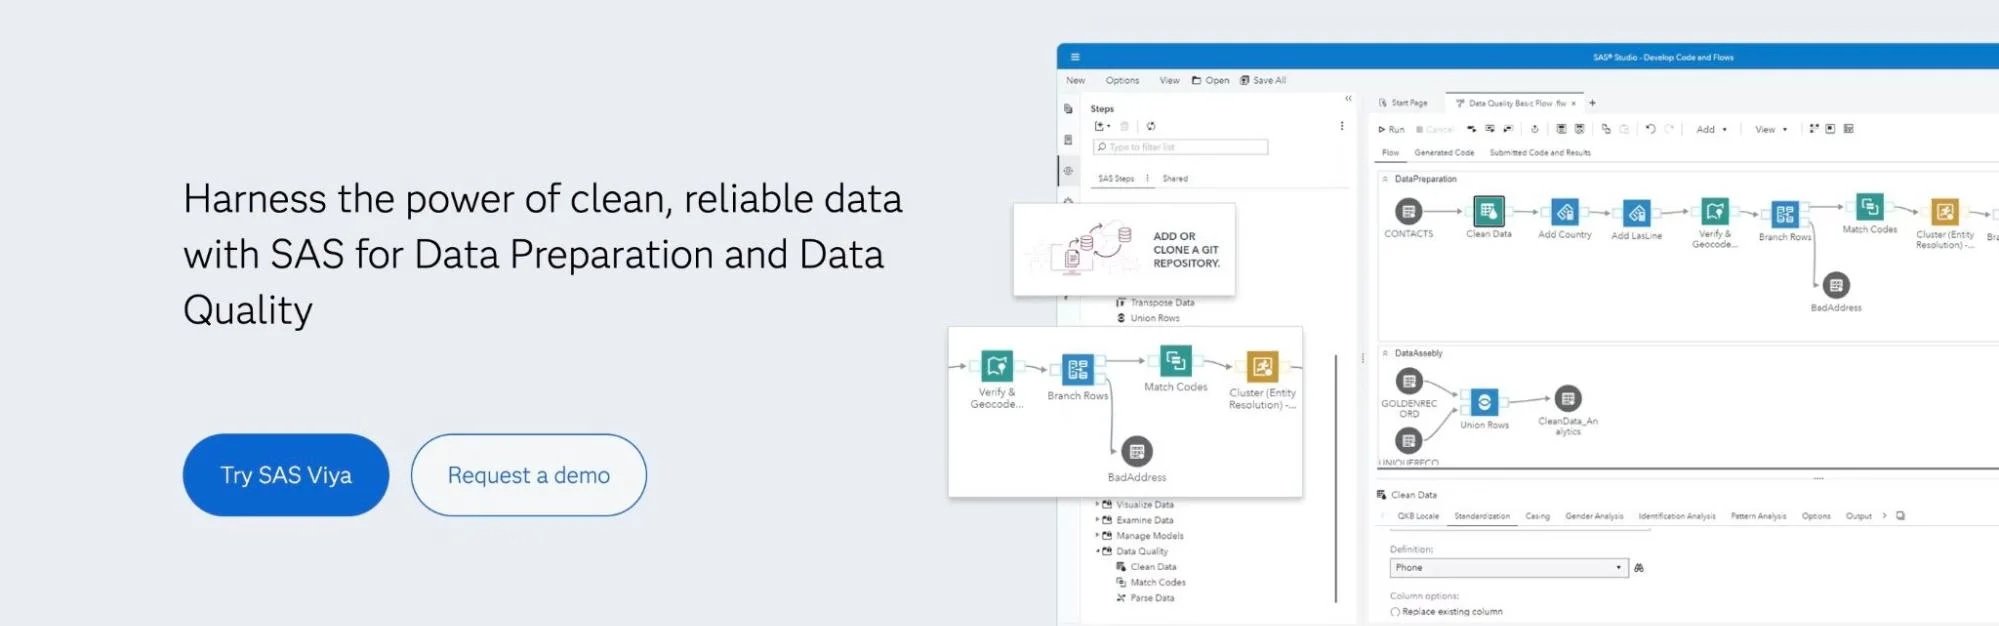
SAS Data Quality improves data accuracy and consistency by identifying errors, removing duplicates, and standardizing formats. It employs the SAS Quality Knowledge Base (QKB), which uses predefined rules to cleanse data into a reliable form.
It also uses fuzzy matching to merge similar records. This ensures no data is duplicated or overlooked due to formatting inconsistencies.
SAS in-database processing also enables data transformations to happen directly in the database, improving efficiency when handling large, complex data.
14. Ringlead Cleanse
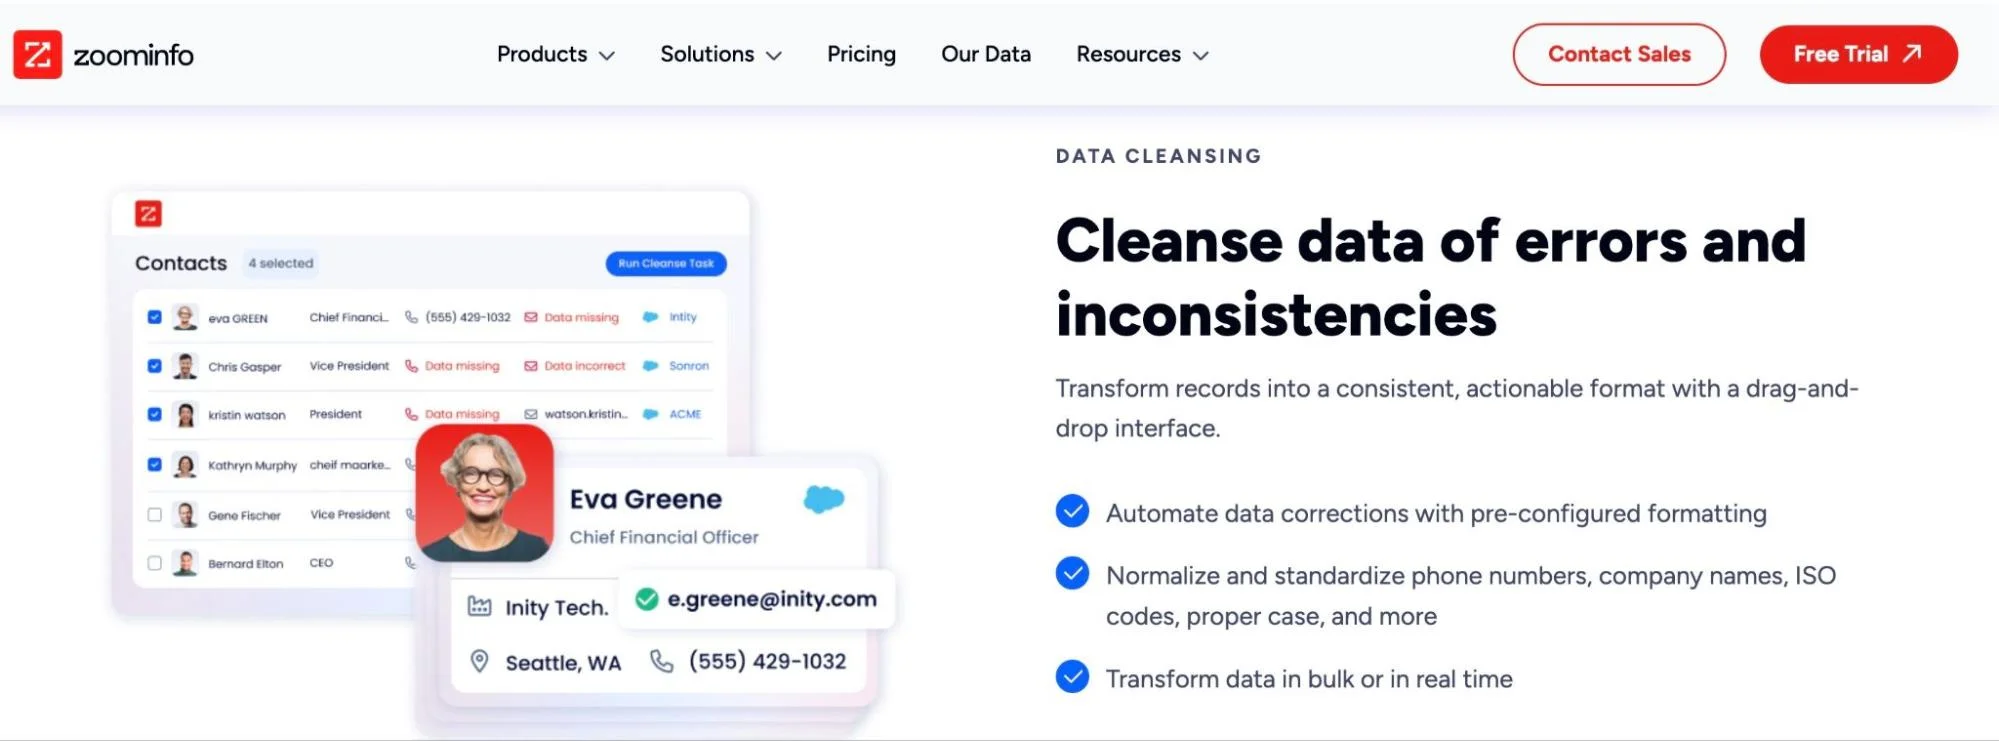
Now part of ZoomInfo, Ringlead Cleanse is a cloud-based data cleansing platform that identifies and removes duplicate records from B2B databases.
One of its major features is the custom-object deduplication. This enables users to clean data spanning multiple objects such as accounts, leads, or opportunities.
RingLead Cleanse also performs mass updates and deletions to handle data errors at scale. This is especially beneficial for users needing to modify numerous records based on changes in business processes or data structures. Users can also apply bulk normalization techniques to ensure that data is standardized and consistent across all fields and systems.
15. Integrate.io

Integrate.io, formally Xplenty offers unlimited data ingestion, allowing businesses to collect data from over 200 sources. Once the data is collected, it can be transformed and cleansed before being sent to its final destination, ensuring it’s ready for analysis or storage.
Integrate.io is also built to scale, handling small, automated processes or complex data with millions of records per minute. It features a low-code interface for most tasks and a Python editor for advanced transformations.
Its support for platforms such as HubSpot and Salesforce makes it versatile for marketing, CRM, and analytics users.
to see how CloudZero uses a code-driven approach to organize all your cloud spending.


The Cloud Cost Playbook
The step-by-step guide to cost maturity